Charter 2004 Annual Report Download - page 19
Download and view the complete annual report
Please find page 19 of the 2004 Charter annual report below. You can navigate through the pages in the report by either clicking on the pages listed below, or by using the keyword search tool below to find specific information within the annual report.-
 1
1 -
2
-
3
-
4
-
5
-
6
-
7
-
8
-
 9
9 -
 10
10 -
 11
11 -
 12
12 -
 13
13 -
 14
14 -
 15
15 -
 16
16 -
 17
17 -
 18
18 -
 19
19 -
 20
20 -
 21
21 -
 22
22 -
 23
23 -
 24
24 -
 25
25 -
 26
26 -
 27
27 -
 28
28 -
 29
29 -
30
-
31
-
32
-
33
-
34
-
35
-
36
-
37
-
38
-
39
-
40
-
41
-
42
-
43
-
44
-
45
-
46
-
47
-
48
-
49
-
50
-
51
-
52
-
53
-
54
-
55
-
56
-
57
-
58
-
59
-
60
-
61
-
62
-
63
-
64
-
65
-
66
-
67
-
68
-
69
-
70
-
71
-
72
-
73
-
74
-
75
-
76
-
77
-
78
-
79
-
80
-
81
-
82
-
83
-
84
-
85
-
86
-
87
-
88
-
89
-
90
-
91
-
92
-
93
-
94
-
95
-
96
-
97
-
98
-
99
-
100
-
101
-
102
-
103
-
104
-
105
-
106
-
107
-
108
-
109
-
110
-
111
-
112
-
113
-
114
-
115
-
116
-
117
-
118
-
119
-
120
-
121
-
122
-
123
-
124
-
125
-
126
-
127
-
128
-
129
-
130
-
131
-
132
-
133
-
134
-
135
-
136
-
137
-
138
-
139
-
140
-
141
-
142
-
143
-
144
-
145
-
146
-
147
-
148
-
149
-
150
-
151
-
152
 |
 |

CHARTER COMMUNICATIONS, INC. 2004 FORM 10-K
From time to time, certain of our vendors, including fee, which is sometimes waived or discounted during certain
equipment vendors, have purchased advertising from us. For the promotional periods, is charged to new customers. The prices
years ending December 31, 2004, 2003 and 2002, we had we charge vary based on the level of service the customer
advertising revenues from vendors of approximately $16 million, chooses and the geographic market. Most of our pricing is
$15 million, and $79 million, respectively. These revenues reviewed and adjusted on an annual basis.
resulted from purchases at market rates pursuant to binding In accordance with the Federal Communications Commis-
agreements. sion’s rules, the prices we charge for cable-related equipment,
such as set-top terminals and remote control devices, and for
PRICING OF OUR PRODUCTS AND SERVICES installation services are based on actual costs plus a permitted
rate of return.
Our revenues are derived principally from the monthly fees our
customers pay for the services we offer. A one-time installation
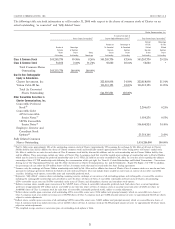
Although our cable service offerings vary across the markets we serve because of various factors including competition and
regulatory factors, our services, when offered on a stand-alone basis, are typically offered at monthly price ranges, excluding franchise
fees and other taxes, as follows:
Price Range as of
Service December 31, 2004
Analog video packages $ 7.00 — $ 54.00
Premium channels $10.00 — $ 15.00
Pay-per-view events $ 2.99 — $179.00
Digital video packages (including high-speed data service for higher tiers) $34.00 — $112.00
High-speed data service $21.95 — $ 49.99
Video on demand (per selection) $ 0.99 — $ 29.99
High definition television $ 3.99 — $ 6.99
Digital video recorder (DVR) $ 6.99 — $ 9.99
In addition, from time to time we offer free service or reducing the number of headends reduces related equipment,
reduced-price service during promotional periods in order to service personnel and maintenance expenditures. We believe
attract new customers. There is no assurance that these that the headend consolidation, together with our other
customers will remain as customers when the period of free upgrades, allows us to provide enhanced picture quality and
service expires. greater system reliability. As a result of the upgrade, approxi-
mately 84% of our customers were served by headends serving
OUR NETWORK TECHNOLOGY at least 10,000 customers as of December 31, 2004.
As of December 31, 2004, our cable systems consisted of
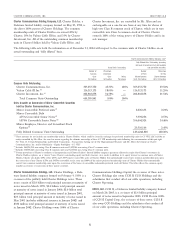
The following table sets forth the technological capacity of our approximately 222,100 strand miles, including approximately
systems as of December 31, 2004 based on a percentage of 53,600 strand miles of fiber optic cable, passing approximately
homes passed: 12.1 million households and served approximately 6.2 million
550 megahertz customers.
Less than to Two-way Two-way
550 megahertz 660 megahertz 750 megahertz 870 megahertz capability enabled We adopted the hybrid fiber coaxial cable (‘‘HFC’’)
8% 5% 42% 45% 92% 87% architecture as the standard for our systems upgrades. HFC
architecture combines the use of fiber optic cable with coaxial
As a result of the upgrade of our systems over the past
cable. Fiber optic cable is a communication medium that uses
several years, approximately 92% of our homes passed are
glass fibers to transmit signals over long distances with
served by systems that have bandwidth of 550 megahertz or
minimum signal loss or distortion. Fiber optic cable has
greater. This bandwidth capacity enables us to offer digital
excellent broadband frequency characteristics, noise immunity
television, high-speed data services and other advanced services.
and physical durability and can carry hundreds of video, data
It also enables us to offer up to 82 analog channels, and even
and voice channels over extended distances. Coaxial cable is less
more channels when our bandwidth is used for digital signal
expensive and requires a more extensive signal amplification in
transmissions. Our increased bandwidth also permits two-way
order to obtain the desired transmission levels for delivering
communication for Internet access, interactive services, and
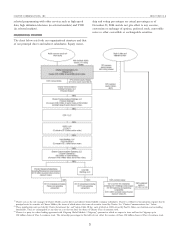
channels. In most systems, we deliver our signals via fiber optic
potentially, telephony services.
cable from the headend to a group of nodes, and use coaxial
As part of our systems upgrade and partly as a result of
cable to deliver the signal from individual nodes to the homes
system sales, we reduced the number of headends that serve our
passed served by that node. Our system design enables a
customers from 1,138 at January 1, 2001 to 744 at December 31,
maximum of 500 homes passed to be served by a single node.
2004. Because headends are the control centers of a cable
Currently, our average node serves approximately 385 homes
system, where incoming signals are amplified, converted,
passed. Our system design provides for six strands of fiber to
processed and combined for transmission to the customer,
9