Charter 2004 Annual Report Download - page 47
Download and view the complete annual report
Please find page 47 of the 2004 Charter annual report below. You can navigate through the pages in the report by either clicking on the pages listed below, or by using the keyword search tool below to find specific information within the annual report.-
 1
1 -
2
-
3
-
4
-
5
-
6
-
7
-
8
-
9
-
10
-
11
-
12
-
13
-
14
-
15
-
16
-
17
-
18
-
19
-
20
-
21
-
22
-
23
-
24
-
25
-
26
-
27
-
28
-
29
-
30
-
31
-
32
-
33
-
34
-
35
-
36
-
 37
37 -
 38
38 -
 39
39 -
 40
40 -
 41
41 -
 42
42 -
 43
43 -
 44
44 -
 45
45 -
 46
46 -
 47
47 -
 48
48 -
 49
49 -
 50
50 -
 51
51 -
 52
52 -
 53
53 -
 54
54 -
 55
55 -
 56
56 -
 57
57 -
58
-
59
-
60
-
61
-
62
-
63
-
64
-
65
-
66
-
67
-
68
-
69
-
70
-
71
-
72
-
73
-
74
-
75
-
76
-
77
-
78
-
79
-
80
-
81
-
82
-
83
-
84
-
85
-
86
-
87
-
88
-
89
-
90
-
91
-
92
-
93
-
94
-
95
-
96
-
97
-
98
-
99
-
100
-
101
-
102
-
103
-
104
-
105
-
106
-
107
-
108
-
109
-
110
-
111
-
112
-
113
-
114
-
115
-
116
-
117
-
118
-
119
-
120
-
121
-
122
-
123
-
124
-
125
-
126
-
127
-
128
-
129
-
130
-
131
-
132
-
133
-
134
-
135
-
136
-
137
-
138
-
139
-
140
-
141
-
142
-
143
-
144
-
145
-
146
-
147
-
148
-
149
-
150
-
151
-
152
 |
 |

CHARTER COMMUNICATIONS, INC. 2004 FORM 10-K
Programming costs consist primarily of costs paid to increase in depreciation expense related to additional capital
programmers for analog, premium and digital channels and pay- expenditures in 2003 and 2002.
per-view programs. The increase in programming costs of Impairment of franchises. We performed our annual
$83 million, or 7%, was due to price increases, particularly in impairment assessments on October 1, 2002 and 2003. Revised
sports programming, and due to an increased number of estimates of future cash flows and the use of a lower projected
channels carried on our systems, partially offset by decreases in long-term growth rate in our valuation led to a $4.6 billion
analog and digital video customers. Programming costs were impairment charge in the fourth quarter of 2002. Our 2003
offset by the amortization of payments received from program- assessment performed on October 1, 2003 did not result in an
mers in support of launches of new channels against program- impairment.
ming costs of $62 million and $57 million for the year ended Loss on sale of assets, net. Loss on sale of assets for
December 31, 2003 and 2002, respectively. the year ended December 31, 2003 represents $26 million of
Advertising sales expenses consist of costs related to losses related to the disposition of fixed assets offset by the
traditional advertising services provided to advertising customers, $21 million gain recognized on the sale of cable systems in Port
including salaries and benefits and commissions. Advertising Orchard, Washington on October 1, 2003. Loss on sale of assets
sales expenses increased $1 million, or 1%, primarily due to for the year ended December 31, 2002 represents losses related
increased sales commissions, taxes and benefits. Service costs to the disposition of fixed assets.
consist primarily of service personnel salaries and benefits, Option compensation expense, net. Option compensa-
franchise fees, system utilities, Internet service provider fees, tion expense decreased by $1 million for the year ended
maintenance and pole rental expense. The increase in service December 31, 2003 compared to the year ended December 31,
costs of $61 million, or 11%, resulted primarily from additional 2002. Option compensation expense includes expense related to
activity associated with ongoing infrastructure maintenance and exercise prices on certain options that were issued prior to our
customer service, including activities associated with our promo- initial public offering in 1999 that were less than the estimated
tional programs. fair values of our common stock at the time of grant.
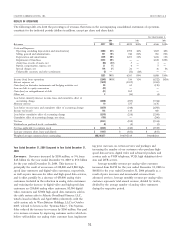
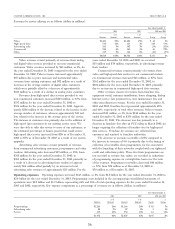
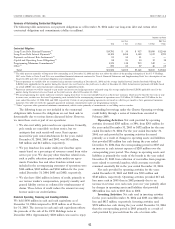
Selling, general and administrative expenses. Selling, gen- Compensation expense is being recognized over the vesting
eral and administrative expenses decreased by $23 million, or period of such options and will continue to be recorded until
2%, from $963 million for the year ended December 31, 2002 to the last vesting period lapses in April 2004. On January 1, 2003,
$940 million for the year ended December 31, 2003. Key we adopted SFAS No. 123, Accounting for Stock-Based Compensa-
components of expense as a percentage of revenues are as tion, using the prospective method under which we will
follows (dollars in millions): recognize compensation expense of a stock-based award to an
employee over the vesting period based on the fair value of the
Year Ended December 31, award on the grant date.
2003 2002 2003 over 2002 Special charges, net. Special charges of $21 million for
% of % of % the year ended December 31, 2003 represent approximately
Expenses Revenues Expenses Revenues Change Change $26 million of severance and related costs of our ongoing
initiative to reduce our workforce partially offset by a $5 million
General and
administrative $833 18% $810 18% $ 23 3% credit from a settlement from the Internet service provider
Excite@Home related to the conversion of about 145,000 high-
Marketing 107 2% 153 3% (46) (30)%
speed data customers to our Charter Pipeline service in 2001. In
$940 20% $963 21% $(23) (2)% the fourth quarter of 2002, we recorded a special charge of
General and administrative expenses consist primarily of $35 million, of which $31 million was associated with our
salaries and benefits, rent expense, billing costs, call center costs, workforce reduction program. The remaining $4 million was
internal network costs, bad debt expense and property taxes. related to legal and other costs associated with our shareholder
The increase in general and administrative expenses of $23 mil- lawsuits and governmental investigations.
lion, or 3%, resulted primarily from increases in salaries and Unfavorable contracts and other settlements. Unfa-
benefits of $4 million, call center costs of $25 million and vorable contracts and other settlements of $72 million for the
internal network costs of $16 million. These increases were year ended December 31, 2003 represents the settlement of
partially offset by a decrease in bad debt and collection expense estimated liabilities recorded in connection with prior business
of $27 million as a result of our strengthened credit policies. combinations. The majority of this benefit (approximately
Marketing expenses decreased $46 million, or 30%, due to $52 million) is due to the renegotiation in 2003 of a major
reduced promotional activity related to our service offerings programming contract, for which a liability had been recorded
including reductions in advertising, telemarketing and direct for the above market portion of that agreement in connection
sales activities. with a 1999 and a 2000 acquisition. The remaining benefit
Depreciation and amortization. Depreciation and relates to the reversal of previously recorded liabilities, which,
amortization expense increased by $17 million, or 1%, from based on an evaluation of current facts and circumstances, are
$1.4 billion in 2002 to $1.5 billion in 2003 due primarily to an no longer required.
37