Charter 2004 Annual Report Download - page 34
Download and view the complete annual report
Please find page 34 of the 2004 Charter annual report below. You can navigate through the pages in the report by either clicking on the pages listed below, or by using the keyword search tool below to find specific information within the annual report.-
 1
1 -
2
-
3
-
4
-
5
-
6
-
7
-
8
-
9
-
10
-
11
-
12
-
13
-
14
-
15
-
16
-
17
-
18
-
19
-
20
-
21
-
22
-
23
-
 24
24 -
 25
25 -
 26
26 -
 27
27 -
 28
28 -
 29
29 -
 30
30 -
 31
31 -
 32
32 -
 33
33 -
 34
34 -
 35
35 -
 36
36 -
 37
37 -
 38
38 -
 39
39 -
 40
40 -
 41
41 -
 42
42 -
 43
43 -
 44
44 -
45
-
46
-
47
-
48
-
49
-
50
-
51
-
52
-
53
-
54
-
55
-
56
-
57
-
58
-
59
-
60
-
61
-
62
-
63
-
64
-
65
-
66
-
67
-
68
-
69
-
70
-
71
-
72
-
73
-
74
-
75
-
76
-
77
-
78
-
79
-
80
-
81
-
82
-
83
-
84
-
85
-
86
-
87
-
88
-
89
-
90
-
91
-
92
-
93
-
94
-
95
-
96
-
97
-
98
-
99
-
100
-
101
-
102
-
103
-
104
-
105
-
106
-
107
-
108
-
109
-
110
-
111
-
112
-
113
-
114
-
115
-
116
-
117
-
118
-
119
-
120
-
121
-
122
-
123
-
124
-
125
-
126
-
127
-
128
-
129
-
130
-
131
-
132
-
133
-
134
-
135
-
136
-
137
-
138
-
139
-
140
-
141
-
142
-
143
-
144
-
145
-
146
-
147
-
148
-
149
-
150
-
151
-
152
 |
 |

CHARTER COMMUNICATIONS, INC. 2004 FORM 10-K
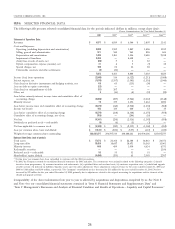
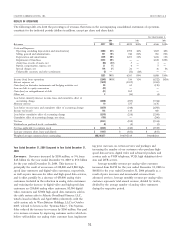
ITEM 6. SELECTED FINANCIAL DATA.
The following table presents selected consolidated financial data for the periods indicated (dollars in millions, except share data):
Charter Communications, Inc. Year Ended December 31,
2004 2003(a) 2002(a) 2001(a)(b) 2000(a)(b)
Statement of Operations Data:
Revenues $ 4,977 $ 4,819 $ 4,566 $ 3,807 $ 3,141
Costs and Expenses:
Operating (excluding depreciation and amortization) 2,080 1,952 1,807 1,486 1,187
Selling, general and administrative 971 940 963 826 606
Depreciation and amortization 1,495 1,453 1,436 2,683 2,398
Impairment of franchises 2,433 — 4,638 ——
(Gain) loss on sale of assets, net (86) 5310—
Option compensation expense (income), net 31 4 5 (5) 38
Special charges, net 104 21 36 18 —
Unfavorable contracts and other settlements (5) (72) ———
7,023 4,303 8,888 5,018 4,229
Income (loss) from operations (2,046) 516 (4,322) (1,211) (1,088)
Interest expense, net (1,670) (1,557) (1,503) (1,310) (1,040)
Gain (loss) on derivative instruments and hedging activities, net 69 65 (115) (50) —
Loss on debt to equity conversions (23)————
Gain (loss) on extinguishment of debt (31) 267 ———
Other, net 3(16) (4) (59) (20)
Loss before minority interest, income taxes and cumulative effect of
accounting change (3,698) (725) (5,944) (2,630) (2,148)
Minority interest 19 377 3,176 1,461 1,280
Loss before income taxes and cumulative effect of accounting change (3,679) (348) (2,768) (1,169) (868)
Income tax benefit 103 110 460 12 10
Loss before cumulative effect of accounting change (3,576) (238) (2,308) (1,157) (858)
Cumulative effect of accounting change, net of tax (765) — (206) (10) —
Net loss (4,341) (238) (2,514) (1,167) (858)
Dividends on preferred stock —redeemable (4) (4) (3) (1) —
Net loss applicable to common stock $ (4,345) $ (242) $ (2,517) $ (1,168) $ (858)
Loss per common share, basic and diluted $ (14.47) $ (0.82) $ (8.55) $ (4.33) $ (3.80)
Weighted-average common shares outstanding 300,291,877 294,597,519 294,440,261 269,594,386 225,697,775
Balance Sheet Data (end of period):
Total assets $ 17,673 $ 21,364 $ 22,384 $ 26,463 $ 24,352
Long-term debt 19,464 18,647 18,671 16,343 13,061
Minority interest 648 689 1,050 4,434 4,571
Redeemable securities ————1,104
Preferred stock —redeemable 55 55 51 51 —
Shareholders’ equity (deficit) (4,406) (175) 41 2,585 2,767
(a) Certain prior year amounts have been reclassified to conform with the 2004 presentation.
(b) In 2002, the Company restated its consolidated financial statements for 2001 and prior. The restatements were primarily related to the following categories: (i) launch
incentives from programmers; (ii) customer incentives and inducements; (iii) capitalized labor and overhead costs; (iv) customer acquisition costs; (v) rebuild and upgrade
of cable systems; (vi) deferred tax liabilities/franchise assets; and (vii) other adjustments. These adjustments reduced revenue for the years ended December 31, 2001 and
2000 by $146 million and $108 million, respectively. The Company’s consolidated net loss decreased by $11 million for the year ended December 31, 2001. Net loss
increased by $29 million for the year ended December 31, 2000, primarily due to adjustments related to the original accounting for acquisitions and for elements of the
rebuild and upgrade activities.
Comparability of the above information from year to year is affected by acquisitions and dispositions completed by us. See Note 2
and Note 4 to our consolidated financial statements contained in ‘‘Item 8. Financial Statements and Supplementary Data’’ and
‘‘Item 7. Management’s Discussion and Analysis of Financial Condition and Results of Operations — Liquidity and Capital Resources.’’
24