Charter 2004 Annual Report Download - page 52
Download and view the complete annual report
Please find page 52 of the 2004 Charter annual report below. You can navigate through the pages in the report by either clicking on the pages listed below, or by using the keyword search tool below to find specific information within the annual report.-
 1
1 -
2
-
3
-
4
-
5
-
6
-
7
-
8
-
9
-
10
-
11
-
12
-
13
-
14
-
15
-
16
-
17
-
18
-
19
-
20
-
21
-
22
-
23
-
24
-
25
-
26
-
27
-
28
-
29
-
30
-
31
-
32
-
33
-
34
-
35
-
36
-
37
-
38
-
39
-
40
-
41
-
 42
42 -
 43
43 -
 44
44 -
 45
45 -
 46
46 -
 47
47 -
 48
48 -
 49
49 -
 50
50 -
 51
51 -
 52
52 -
 53
53 -
 54
54 -
 55
55 -
 56
56 -
 57
57 -
 58
58 -
 59
59 -
 60
60 -
 61
61 -
 62
62 -
63
-
64
-
65
-
66
-
67
-
68
-
69
-
70
-
71
-
72
-
73
-
74
-
75
-
76
-
77
-
78
-
79
-
80
-
81
-
82
-
83
-
84
-
85
-
86
-
87
-
88
-
89
-
90
-
91
-
92
-
93
-
94
-
95
-
96
-
97
-
98
-
99
-
100
-
101
-
102
-
103
-
104
-
105
-
106
-
107
-
108
-
109
-
110
-
111
-
112
-
113
-
114
-
115
-
116
-
117
-
118
-
119
-
120
-
121
-
122
-
123
-
124
-
125
-
126
-
127
-
128
-
129
-
130
-
131
-
132
-
133
-
134
-
135
-
136
-
137
-
138
-
139
-
140
-
141
-
142
-
143
-
144
-
145
-
146
-
147
-
148
-
149
-
150
-
151
-
152
 |
 |

CHARTER COMMUNICATIONS, INC. 2004 FORM 10-K
systems to Atlantic Broadband Finance, LLC offset by increased be composed primarily of purchases of customer premise
cash used for capital expenditures. equipment and for scalable infrastructure costs. We expect to
Net cash used in investing activities for the years ended fund capital expenditures for 2005 primarily from cash flows
December 31, 2003 and 2002 was $817 million and $2.4 billion, from operating activities and borrowings under our credit
respectively. Investing activities used $1.5 billion less cash in facilities.
2003 than in 2002 primarily as a result of reductions in capital We have adopted capital expenditure disclosure guidance,
expenditures and acquisitions. Purchases of property, plant and which was developed by eleven publicly traded cable system
equipment used $1.3 billion less cash in 2003 than in 2002 as a operators, including Charter, with the support of the National
result of reduced rebuild and upgrade activities and our efforts Cable & Telecommunications Association (‘‘NCTA’’). The new
to reduce capital expenditures. Payments for acquisitions used disclosure is intended to provide more consistency in the
$139 million less cash in 2003 than in 2002. reporting of operating statistics in capital expenditures and
Financing Activities. Net cash provided by financing customers among peer companies in the cable industry. These
activities for the year ended December 31, 2004 was $294 mil- disclosure guidelines are not required disclosure under GAAP,
lion and the net cash used in financing activities for the year nor do they impact our accounting for capital expenditures
ended December 31, 2003 was $142 million. The increase in under GAAP.
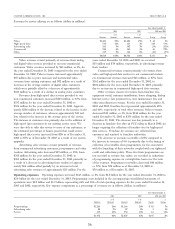
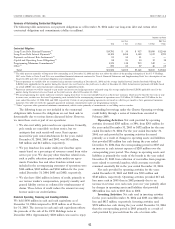
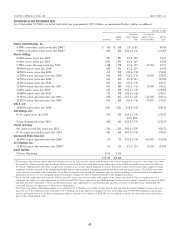
cash provided during the year ended December 31, 2004, as The following table presents our major capital expenditures
compared to the corresponding period in 2003, was primarily categories in accordance with NCTA disclosure guidelines for
the result of an increase in borrowings of long-term debt and the years ended December 31, 2004, 2003 and 2002 (dollars in
proceeds from issuance of debt reduced by repayments of long- millions):
term debt.
For the Years Ended
Net cash used in financing activities was $142 million for December 31,
the year ended December 31, 2003, whereas net cash provided 2004 2003 2002
by financing activities for the year ended December 31, 2002 Customer premise equipment(a) $451 $380 $ 748
was $1.9 billion. Financing activities provided $2.1 billion less Scalable infrastructure(b) 108 67 261
cash in 2003 than in 2002. The decrease in cash provided in Line extensions(c) 131 131 101
2003 compared to 2002 was primarily due to a decrease in Upgrade/Rebuild(d) 49 132 777
Support capital(e) 185 144 280
borrowings of long-term debt.
Total capital expenditures(f) $924 $854 $2,167
Capital Expenditures (a) Customer premise equipment includes costs incurred at the customer residence
We have significant ongoing capital expenditure requirements. to secure new customers, revenue units and additional bandwidth revenues. It
also includes customer installation costs in accordance with SFAS 51 and
However, we experienced a significant decline in such require- customer premise equipment (e.g., set-top terminals and cable modems, etc.).
ments starting in 2003. This decline was primarily the result of a (b) Scalable infrastructure includes costs, not related to customer premise equipment
substantial reduction in rebuild costs as our network had been or our network, to secure growth of new customers, revenue units and
additional bandwidth revenues or provide service enhancements (e.g., headend
largely upgraded and rebuilt in prior years. Capital expenditures, equipment).
excluding acquisitions of cable systems, were $924 million, (c) Line extensions include network costs associated with entering new service areas
$854 million and $2.2 billion for the years ended December 31, (e.g., fiber/coaxial cable, amplifiers, electronic equipment, make-ready and design
engineering).
2004, 2003 and 2002, respectively. The majority of the capital (d) Upgrade/rebuild includes costs to modify or replace existing fiber/coaxial cable
expenditures in 2004 and 2003 related to our customer premise networks, including betterments.
equipment costs. The majority of the capital expenditures in (e) Support capital includes costs associated with the replacement or enhancement
of non-network assets due to technological and physical obsolescence (e.g., non-
2002 related to our rebuild and upgrade program and purchases network equipment, land, buildings and vehicles).
of customer premise equipment. See the table below for more (f) Represents all capital expenditures made in 2004, 2003 and 2002, respectively.
details.
Upgrading our cable systems has enabled us to offer digital
television, high-speed data services, VOD, interactive services,
additional channels and tiers, and expanded pay-per-view
options to a larger customer base. Our capital expenditures are
funded primarily from cash flows from operating activities, the
issuance of debt and borrowings under credit facilities. In
addition, during the years ended December 31, 2004, 2003 and
2002, our liabilities related to capital expenditures decreased
$43 million, $33 million and $55 million, respectively.
During 2005, we expect capital expenditures to increase to
approximately $1 billion. The increase in capital expenditures for
2005 compared to 2004 is the result of expected increases in
telephony services and deployment of advanced digital boxes.
We expect that the nature of these expenditures will continue to
42