Charter 2004 Annual Report Download - page 51
Download and view the complete annual report
Please find page 51 of the 2004 Charter annual report below. You can navigate through the pages in the report by either clicking on the pages listed below, or by using the keyword search tool below to find specific information within the annual report.-
 1
1 -
2
-
3
-
4
-
5
-
6
-
7
-
8
-
9
-
10
-
11
-
12
-
13
-
14
-
15
-
16
-
17
-
18
-
19
-
20
-
21
-
22
-
23
-
24
-
25
-
26
-
27
-
28
-
29
-
30
-
31
-
32
-
33
-
34
-
35
-
36
-
37
-
38
-
39
-
40
-
 41
41 -
 42
42 -
 43
43 -
 44
44 -
 45
45 -
 46
46 -
 47
47 -
 48
48 -
 49
49 -
 50
50 -
 51
51 -
 52
52 -
 53
53 -
 54
54 -
 55
55 -
 56
56 -
 57
57 -
 58
58 -
 59
59 -
 60
60 -
 61
61 -
62
-
63
-
64
-
65
-
66
-
67
-
68
-
69
-
70
-
71
-
72
-
73
-
74
-
75
-
76
-
77
-
78
-
79
-
80
-
81
-
82
-
83
-
84
-
85
-
86
-
87
-
88
-
89
-
90
-
91
-
92
-
93
-
94
-
95
-
96
-
97
-
98
-
99
-
100
-
101
-
102
-
103
-
104
-
105
-
106
-
107
-
108
-
109
-
110
-
111
-
112
-
113
-
114
-
115
-
116
-
117
-
118
-
119
-
120
-
121
-
122
-
123
-
124
-
125
-
126
-
127
-
128
-
129
-
130
-
131
-
132
-
133
-
134
-
135
-
136
-
137
-
138
-
139
-
140
-
141
-
142
-
143
-
144
-
145
-
146
-
147
-
148
-
149
-
150
-
151
-
152
 |
 |

CHARTER COMMUNICATIONS, INC. 2004 FORM 10-K
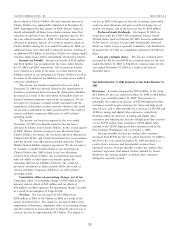
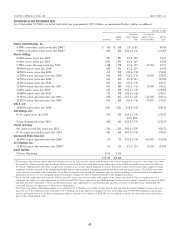
Summary of Outstanding Contractual Obligations
The following table summarizes our payment obligations as of December 31, 2004 under our long-term debt and certain other
contractual obligations and commitments (dollars in millions).
Payments by Period
Less than More than
Total 1 Year 1-3 Years 3-5 Years 5 Years
Contractual Obligations
Long-Term Debt Principal Payments(1) $19,791 $ 30 $ 917 $5,898 $12,946
Long-Term Debt Interest Payments(2) 10,109 1,454 3,348 3,332 1,975
Payments on Interest Rate Instruments(3) 81 50 31 ——
Capital and Operating Lease Obligations(1) 88 23 30 17 18
Programming Minimum Commitments(4) 1,579 318 719 542 —
Other(5) 272 62 97 46 67
Total $31,920 $1,937 $5,142 $9,835 $15,006
(1) The table presents maturities of long-term debt outstanding as of December 31, 2004 and does not reflect the effects of the pending redemption of the CC V Holdings,
LLC notes. Refer to Notes 9 and 23 to our consolidated financial statements contained in ‘‘Item 8. Financial Statements and Supplementary Data’’ for a description of our
long-term debt and other contractual obligations and commitments.
(2) Interest payments on variable debt are estimated using amounts outstanding at December 31, 2004 and the average implied forward London Interbank Offering Rate
(LIBOR) rates applicable for the quarter during the interest rate reset based on the yield curve in effect at December 31, 2004. Actual interest payments will differ based
on actual LIBOR rates and actual amounts outstanding for applicable periods.
(3) Represents amounts we will be required to pay under our interest rate hedge agreements estimated using the average implied forward LIBOR applicable rates for the
quarter during the interest rate reset based on the yield curve in effect at December 31, 2004.
(4) We pay programming fees under multi-year contracts ranging from three to six years typically based on a flat fee per customer, which may be fixed for the term or may
in some cases, escalate over the term. Programming costs included in the accompanying statement of operations were $1.3 billion, $1.2 billion and $1.2 billion for the
years ended December 31, 2004, 2003 and 2002, respectively. Certain of our programming agreements are based on a flat fee per month or have guaranteed minimum
payments. The table sets forth the aggregate guaranteed minimum commitments under our programming contracts.
(5) ‘‘Other’’ represents other guaranteed minimum commitments, which consist primarily of commitments to our billing services vendors.
The following items are not included in the contractual outstanding borrowings under the Charter Operating revolving
obligations table because the obligations are not fixed and/or credit facility through a series of transactions executed in
determinable due to various factors discussed below. However, February 2005.
we incur these costs as part of our operations: Operating Activities. Net cash provided by operating
activities decreased $293 million, or 38%, from $765 million for
(We also rent utility poles used in our operations. Generally, the year ended December 31, 2003 to $472 million for the year
pole rentals are cancelable on short notice, but we ended December 31, 2004. For the year ended December 31,
anticipate that such rentals will recur. Rent expense 2004, net cash provided by operating activities decreased
incurred for pole rental attachments for the years ended primarily as a result of changes in operating assets and liabilities
December 31, 2004, 2003 and 2002, was $43 million, that provided $83 million less cash during the year ended
$40 million and $41 million, respectively. December 31, 2004 than the corresponding period in 2003 and
(We pay franchise fees under multi-year franchise agree- an increase in cash interest expense of $203 million over the
ments based on a percentage of revenues earned from video corresponding prior period. The change in operating assets and
service per year. We also pay other franchise related costs, liabilities is primarily the result of the benefit in the year ended
such as public education grants under multi-year agree- December 31, 2003 from collection of receivables from program-
ments. Franchise fees and other franchise-related costs mers related to network launches, while accounts receivable
included in the accompanying statement of operations were remained essentially flat in the year ended December 31, 2004.
$164 million, $162 million and $160 million for the years Net cash provided by operating activities for the years
ended December 31, 2004, 2003 and 2002, respectively. ended December 31, 2003 and 2002 was $765 million and
$748 million, respectively. Operating activities provided $17 mil-
(We also have $166 million in letters of credit, primarily to lion more cash in 2003 than in 2002 primarily due to an
our various worker’s compensation, property casualty and increase in revenue over cash costs year over year partially offset
general liability carriers as collateral for reimbursement of by changes in operating assets and liabilities that provided
claims. These letters of credit reduce the amount we may $82 million less cash in 2003 than in 2002.
borrow under our credit facilities. Investing Activities. Net cash used in investing activities
Historical Operating, Financing and Investing Activities for the year ended December 31, 2004 and 2003 was $243 mil-
We held $650 million in cash and cash equivalents as of lion and $817 million, respectively. Investing activities used
December 31, 2004 compared to $127 million as of Decem- $574 million less cash during the year ended December 31, 2004
ber 31, 2003. The increase in cash and cash equivalents reflects than the corresponding period in 2003 primarily as a result of
the proceeds of the sale of the CCO Holdings notes in cash provided by proceeds from the sale of certain cable
December 2004. Approximately $622 million was used to repay
41