Charter 2004 Annual Report Download - page 41
Download and view the complete annual report
Please find page 41 of the 2004 Charter annual report below. You can navigate through the pages in the report by either clicking on the pages listed below, or by using the keyword search tool below to find specific information within the annual report.-
 1
1 -
2
-
3
-
4
-
5
-
6
-
7
-
8
-
9
-
10
-
11
-
12
-
13
-
14
-
15
-
16
-
17
-
18
-
19
-
20
-
21
-
22
-
23
-
24
-
25
-
26
-
27
-
28
-
29
-
30
-
 31
31 -
 32
32 -
 33
33 -
 34
34 -
 35
35 -
 36
36 -
 37
37 -
 38
38 -
 39
39 -
 40
40 -
 41
41 -
 42
42 -
 43
43 -
 44
44 -
 45
45 -
 46
46 -
 47
47 -
 48
48 -
 49
49 -
 50
50 -
 51
51 -
52
-
53
-
54
-
55
-
56
-
57
-
58
-
59
-
60
-
61
-
62
-
63
-
64
-
65
-
66
-
67
-
68
-
69
-
70
-
71
-
72
-
73
-
74
-
75
-
76
-
77
-
78
-
79
-
80
-
81
-
82
-
83
-
84
-
85
-
86
-
87
-
88
-
89
-
90
-
91
-
92
-
93
-
94
-
95
-
96
-
97
-
98
-
99
-
100
-
101
-
102
-
103
-
104
-
105
-
106
-
107
-
108
-
109
-
110
-
111
-
112
-
113
-
114
-
115
-
116
-
117
-
118
-
119
-
120
-
121
-
122
-
123
-
124
-
125
-
126
-
127
-
128
-
129
-
130
-
131
-
132
-
133
-
134
-
135
-
136
-
137
-
138
-
139
-
140
-
141
-
142
-
143
-
144
-
145
-
146
-
147
-
148
-
149
-
150
-
151
-
152
 |
 |

CHARTER COMMUNICATIONS, INC. 2004 FORM 10-K
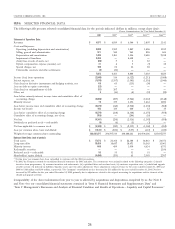
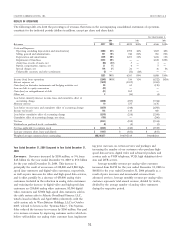
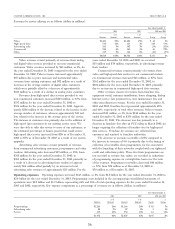
RESULTS OF OPERATIONS
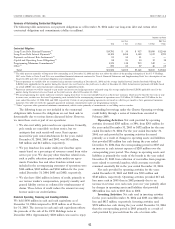
The following table sets forth the percentages of revenues that items in the accompanying consolidated statements of operations
constitute for the indicated periods (dollars in millions, except per share and share data):
Year Ended December 31,
2004 2003 2002
Revenues $ 4,977 100% $ 4,819 100% $ 4,566 100%
Costs and Expenses:
Operating (excluding depreciation and amortization) 2,080 42% 1,952 40% 1,807 40%
Selling, general and administrative 971 19% 940 20% 963 21%
Depreciation and amortization 1,495 30% 1,453 30% 1,436 31%
Impairment of franchises 2,433 49% — — 4,638 102%
(Gain) loss on sale of assets, net (86) (2)% 5—3—
Option compensation expense, net 31 1% 4—5—
Special charges, net 104 2% 21 —36 1%
Unfavorable contracts and other settlements (5) — (72) (1)% ——
7,023 141% 4,303 89% 8,888 195%
Income (loss) from operations (2,046) (41)% 516 11% (4,322) (95)%
Interest expense, net (1,670) (1,557) (1,503)
Gain (loss) on derivative instruments and hedging activities, net 69 65 (115)
Loss on debt to equity conversions (23) — —
Gain (loss) on extinguishment of debt (31) 267 —
Other, net 3(16) (4)
Loss before minority interest, income taxes and cumulative effect of
accounting change (3,698) (725) (5,944)
Minority interest 19 377 3,176
Loss before income taxes and cumulative effect of accounting change (3,679) (348) (2,768)
Income tax benefit 103 110 460
Loss before cumulative effect of accounting change (3,576) (238) (2,308)
Cumulative effect of accounting change, net of tax (765) — (206)
Net loss (4,341) (238) (2,514)
Dividends on preferred stock — redeemable (4) (4) (3)
Net loss applicable to common stock $ (4,345) $ (242) $ (2,517)
Loss per common share, basic and diluted $ (14.47) $ (0.82) $ (8.55)
Weighted average common shares outstanding 300,291,877 294,597,519 294,440,261
ing price increases on certain services and packages and
Year Ended December 31, 2004 Compared to Year Ended December 31, increasing the number of our customers who purchase high-
2003 speed data services, digital video and advanced products and
Revenues. Revenues increased by $158 million, or 3%, from services such as VOIP telephony, VOD, high definition televi-
$4.8 billion for the year ended December 31, 2003 to $5.0 billion sion and DVR service.
for the year ended December 31, 2004. This increase is Average monthly revenue per analog video customer
principally the result of an increase of 318,800 and 2,800 high- increased from $61.92 for the year ended December 31, 2003 to
speed data customers and digital video customers, respectively, $68.02 for the year ended December 31, 2004 primarily as a
as well as price increases for video and high-speed data services, result of price increases and incremental revenues from
and is offset partially by a decrease of 439,800 analog video advanced services. Average monthly revenue per analog video
customers. Included in the reduction in analog video customers customer represents total annual revenue, divided by twelve,
and reducing the increase in digital video and high-speed data divided by the average number of analog video customers
customers are 230,800 analog video customers, 83,300 digital during the respective period.
video customers and 37,800 high-speed data customers sold in
the cable system sales to Atlantic Broadband Finance, LLC,
which closed in March and April 2004 (collectively, with the
cable system sale to WaveDivision Holdings, LLC in October
2003, referred to herein as the ‘‘Systems Sales’’). The Systems
Sales reduced the increase in revenues by $160 million. Our goal
is to increase revenues by improving customer service which we
believe will stabilize our analog video customer base, implement-
31