Charter 2004 Annual Report Download - page 43
Download and view the complete annual report
Please find page 43 of the 2004 Charter annual report below. You can navigate through the pages in the report by either clicking on the pages listed below, or by using the keyword search tool below to find specific information within the annual report.-
 1
1 -
2
-
3
-
4
-
5
-
6
-
7
-
8
-
9
-
10
-
11
-
12
-
13
-
14
-
15
-
16
-
17
-
18
-
19
-
20
-
21
-
22
-
23
-
24
-
25
-
26
-
27
-
28
-
29
-
30
-
31
-
32
-
 33
33 -
 34
34 -
 35
35 -
 36
36 -
 37
37 -
 38
38 -
 39
39 -
 40
40 -
 41
41 -
 42
42 -
 43
43 -
 44
44 -
 45
45 -
 46
46 -
 47
47 -
 48
48 -
 49
49 -
 50
50 -
 51
51 -
 52
52 -
 53
53 -
54
-
55
-
56
-
57
-
58
-
59
-
60
-
61
-
62
-
63
-
64
-
65
-
66
-
67
-
68
-
69
-
70
-
71
-
72
-
73
-
74
-
75
-
76
-
77
-
78
-
79
-
80
-
81
-
82
-
83
-
84
-
85
-
86
-
87
-
88
-
89
-
90
-
91
-
92
-
93
-
94
-
95
-
96
-
97
-
98
-
99
-
100
-
101
-
102
-
103
-
104
-
105
-
106
-
107
-
108
-
109
-
110
-
111
-
112
-
113
-
114
-
115
-
116
-
117
-
118
-
119
-
120
-
121
-
122
-
123
-
124
-
125
-
126
-
127
-
128
-
129
-
130
-
131
-
132
-
133
-
134
-
135
-
136
-
137
-
138
-
139
-
140
-
141
-
142
-
143
-
144
-
145
-
146
-
147
-
148
-
149
-
150
-
151
-
152
 |
 |

CHARTER COMMUNICATIONS, INC. 2004 FORM 10-K
video customers. Additionally, the increase in programming otherwise affected by factors similar to the ones mentioned in
costs was reduced by $42 million as a result of the Systems the preceding paragraph. Our increasing programming costs will
Sales. Programming costs were offset by the amortization of result in declining operating margins for our video services to
payments received from programmers in support of launches of the extent we are unable to pass on cost increases to our
new channels of $59 million and $62 million for the year ended customers. We expect to partially offset any resulting margin
December 31, 2004 and 2003, respectively. Programming costs compression from our traditional video services with revenue
for the year ended December 31, 2004 also include a $5 million from advanced video services, increased high-speed data reve-
reduction related to the settlement of a dispute with TechTV, nues, advertising revenues and commercial service revenues.
Inc., a related party. See Note 22 to the consolidated financial Advertising sales expenses consist of costs related to
statements contained in ‘‘Item 8. Financial Statements and traditional advertising services provided to advertising customers,
Supplementary Data.’’ including salaries, benefits and commissions. Advertising sales
In every year we have operated, our cable programming expenses increased $10 million, or 11%, primarily as a result of
costs have increased in excess of the U.S. inflation and cost-of- increased salary, benefit and commission costs. The increase in
living increases, and we expect them to continue to increase advertising sales expenses was reduced by $2 million as a result
because of a variety of factors, including inflationary or of the System Sales. Service costs consist primarily of service
negotiated annual increases, additional programming being personnel salaries and benefits, franchise fees, system utilities,
provided to customers and increased costs to purchase or Internet service provider fees, maintenance and pole rental
produce programming. In 2005, we expect programming costs expense. The increase in service costs of $48 million, or 8%,
to increase at a higher rate than in 2004. These costs will be resulted primarily from additional activity associated with
determined in part on the outcome of programming negotia- ongoing infrastructure maintenance. The increase in service
tions in 2005 and will likely be subject to offsetting events or costs was reduced by $15 million as a result of the System Sales.
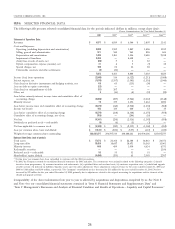
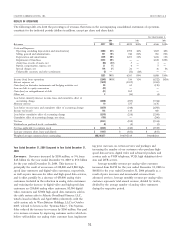
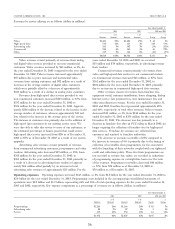
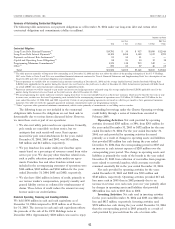
Selling, general and administrative expenses. Selling, general and administrative expenses increased by $31 million, or 3%, from
$940 million for the year ended December 31, 2003 to $971 million for the year ended December 31, 2004. The increase in selling,
general and administrative expenses was reduced by $22 million as a result of the System Sales. Key components of expense as a
percentage of revenues were as follows (dollars in millions):
Year Ended December 31,
2004 2003 2004 over 2003
% of % of %
Expenses Revenues Expenses Revenues Change Change
General and administrative $ 849 17% $ 833 18% $ 16 2%
Marketing 122 2% 107 2% 15 14%
$ 971 19% $ 940 20% $ 31 3%
General and administrative expenses consist primarily of of future cash flows in our valuation, primarily as a result of
salaries and benefits, rent expense, billing costs, call center costs, increased competition, led to the recognition of a $2.4 billion
internal network costs, bad debt expense and property taxes. impairment charge for the year ended December 31, 2004.
The increase in general and administrative expenses of $16 mil- (Gain) loss on sale of assets, net. Gain on sale of
lion, or 2%, resulted primarily from increases in costs associated assets of $86 million for the year ended December 31, 2004
with our commercial business of $21 million, third party call primarily represents the pretax gain of $104 million realized on
center costs resulting from increased emphasis on customer the sale of systems to Atlantic Broadband Finance, LLC which
service of $10 million and bad debt expense of $10 million offset closed in March and April 2004 offset by losses recognized on
by decreases in costs associated with salaries and benefits of the disposition of plant and equipment. Loss on sale of assets of
$21 million and rent expense of $3 million. $5 million for the year ended December 31, 2003 represents the
Marketing expenses increased $15 million, or 14%, as a loss recognized on the disposition of plant and equipment offset
result of an increased investment in marketing and branding by a gain of $21 million recognized on the sale of cable systems
campaigns. in Port Orchard, Washington which closed on October 1, 2003.
Depreciation and amortization. Depreciation and Option compensation expense, net. Option compensa-
amortization expense increased by $42 million, or 3%, to tion expense of $31 million for the year ended December 31,
$1.5 billion in 2004. The increase in depreciation related to an 2004 primarily represents $22 million related to options granted
increase in capital expenditures, which was partially offset by and expensed in accordance with SFAS No. 123, Accounting for
lower depreciation as the result of the Systems Sales. Stock-Based Compensation. Additionally, during the year ended
Impairment of franchises. We performed an impair- December 31, 2004, we expensed approximately $8 million
ment assessment during the third quarter of 2004. The use of related to a stock option exchange program, under which our
lower projected growth rates and the resulting revised estimates employees were offered the right to exchange all stock options
(vested and unvested) issued under the 1999 Charter Communi-
33