Charter 2004 Annual Report Download - page 42
Download and view the complete annual report
Please find page 42 of the 2004 Charter annual report below. You can navigate through the pages in the report by either clicking on the pages listed below, or by using the keyword search tool below to find specific information within the annual report.-
 1
1 -
2
-
3
-
4
-
5
-
6
-
7
-
8
-
9
-
10
-
11
-
12
-
13
-
14
-
15
-
16
-
17
-
18
-
19
-
20
-
21
-
22
-
23
-
24
-
25
-
26
-
27
-
28
-
29
-
30
-
31
-
 32
32 -
 33
33 -
 34
34 -
 35
35 -
 36
36 -
 37
37 -
 38
38 -
 39
39 -
 40
40 -
 41
41 -
 42
42 -
 43
43 -
 44
44 -
 45
45 -
 46
46 -
 47
47 -
 48
48 -
 49
49 -
 50
50 -
 51
51 -
 52
52 -
53
-
54
-
55
-
56
-
57
-
58
-
59
-
60
-
61
-
62
-
63
-
64
-
65
-
66
-
67
-
68
-
69
-
70
-
71
-
72
-
73
-
74
-
75
-
76
-
77
-
78
-
79
-
80
-
81
-
82
-
83
-
84
-
85
-
86
-
87
-
88
-
89
-
90
-
91
-
92
-
93
-
94
-
95
-
96
-
97
-
98
-
99
-
100
-
101
-
102
-
103
-
104
-
105
-
106
-
107
-
108
-
109
-
110
-
111
-
112
-
113
-
114
-
115
-
116
-
117
-
118
-
119
-
120
-
121
-
122
-
123
-
124
-
125
-
126
-
127
-
128
-
129
-
130
-
131
-
132
-
133
-
134
-
135
-
136
-
137
-
138
-
139
-
140
-
141
-
142
-
143
-
144
-
145
-
146
-
147
-
148
-
149
-
150
-
151
-
152
 |
 |

CHARTER COMMUNICATIONS, INC. 2004 FORM 10-K
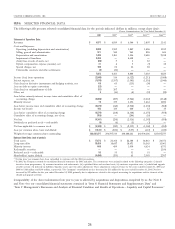
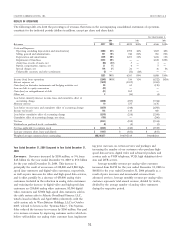
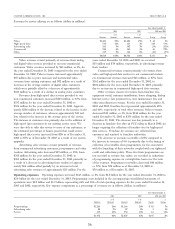
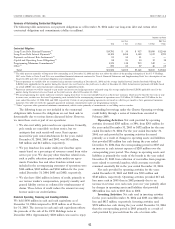
Revenues by service offering were as follows (dollars in millions):
Year Ended December 31,
2004 2003 2004 over 2003
% of % of %
Revenues Revenues Revenues Revenues Change Change
Video $3,373 68% $3,461 72% $ (88) (3)%
High-speed data 741 15% 556 12% 185 33%
Advertising sales 289 6% 263 5% 26 10%
Commercial 238 4% 204 4% 34 17%
Other 336 7% 335 7% 1 —
$4,977 100% $4,819 100% $ 158 3%
Video revenues consist primarily of revenues from analog a result of an increase in national advertising campaigns and
and digital video services provided to our non-commercial election related advertising. The increase was offset by a
customers. Video revenues decreased by $88 million, or 3%, decrease of $7 million as a result of the System Sales. For the
from $3.5 billion for the year ended December 31, 2003 to years ended December 31, 2004 and 2003, we received
$3.4 billion for the year ended December 31, 2004. Approxi- $16 million and $15 million, respectively, in advertising revenue
mately $116 million of the decrease was the result of the from vendors.
Systems Sales and approximately an additional $65 million Commercial revenues consist primarily of revenues from
related to a decline in analog video customers. These decreases cable video and high-speed data services to our commercial
were offset by increases of approximately $66 million resulting customers. Commercial revenues increased $34 million, or 17%,
from price increases and incremental video revenues from from $204 million for the year ended December 31, 2003, to
existing customers and approximately $27 million resulting from $238 million for the year ended December 31, 2004, primarily as
an increase in digital video customers. a result of an increase in commercial high-speed data revenues.
Revenues from high-speed data services provided to our The increase was reduced by approximately $14 million as a
non-commercial customers increased $185 million, or 33%, from result of the Systems Sales.
$556 million for the year ended December 31, 2003 to Other revenues consist of revenues from franchise fees,
$741 million for the year ended December 31, 2004. Approxi- telephony revenue, equipment rental, customer installations,
mately $163 million of the increase related to the increase in the home shopping, dial-up Internet service, late payment fees, wire
average number of customers receiving high-speed data services, maintenance fees and other miscellaneous revenues. For the year
whereas approximately $35 million related to the increase in ended December 31, 2004 and 2003, franchise fees represented
average price of the service. The increase in high-speed data approximately 49% and 48%, respectively, of total other reve-
revenues was reduced by approximately $12 million as a result nues. Other revenues increased $1 million from $335 million for
of the Systems Sales. the year ended December 31, 2003 to $336 million for the year
Advertising sales revenues consist primarily of revenues ended December 31, 2004. The increase was primarily the result
from commercial advertising customers, programmers and other of an increase in home shopping and infomercial revenue and
vendors. Advertising sales increased $26 million, or 10%, from was partially offset by approximately $11 million as a result of
$263 million for the year ended December 31, 2003 to the Systems Sales.
$289 million for the year ended December 31, 2004 primarily as
Operating expenses. Operating expenses increased $128 million, or 7%, from $2.0 billion for the year ended December 31, 2003 to
$2.1 billion for the year ended December 31, 2004. The increase in operating expenses was reduced by approximately $59 million as
a result of the System Sales. Programming costs included in the accompanying consolidated statements of operations were $1.3 billion
and $1.2 billion, representing 63% and 64% of total operating expenses for the years ended December 31, 2004 and 2003, respectively.
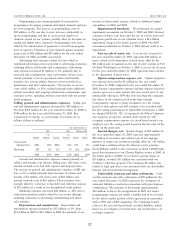
Key expense components as a percentage of revenues were as follows (dollars in millions):
Year Ended December 31,
2004 2003 2004 over 2003
% of % of %
Expenses Revenues Expenses Revenues Change Change
Programming $1,319 27% $1,249 26% $ 70 6%
Advertising sales 98 2% 88 2% 10 11%
Service 663 13% 615 12% 48 8%
$2,080 42% $1,952 40% $ 128 7%
Programming costs consist primarily of costs paid to the year ended December 31, 2003 was a result of price
programmers for analog, premium and digital channels and pay- increases, particularly in sports programming, an increased
per-view programming. The increase in programming costs of number of channels carried on our systems, and an increase in
$70 million, or 6%, for the year ended December 31, 2004 over digital video customers, partially offset by a decrease in analog
32