Charter 2004 Annual Report Download - page 46
Download and view the complete annual report
Please find page 46 of the 2004 Charter annual report below. You can navigate through the pages in the report by either clicking on the pages listed below, or by using the keyword search tool below to find specific information within the annual report.-
 1
1 -
2
-
3
-
4
-
5
-
6
-
7
-
8
-
9
-
10
-
11
-
12
-
13
-
14
-
15
-
16
-
17
-
18
-
19
-
20
-
21
-
22
-
23
-
24
-
25
-
26
-
27
-
28
-
29
-
30
-
31
-
32
-
33
-
34
-
35
-
 36
36 -
 37
37 -
 38
38 -
 39
39 -
 40
40 -
 41
41 -
 42
42 -
 43
43 -
 44
44 -
 45
45 -
 46
46 -
 47
47 -
 48
48 -
 49
49 -
 50
50 -
 51
51 -
 52
52 -
 53
53 -
 54
54 -
 55
55 -
 56
56 -
57
-
58
-
59
-
60
-
61
-
62
-
63
-
64
-
65
-
66
-
67
-
68
-
69
-
70
-
71
-
72
-
73
-
74
-
75
-
76
-
77
-
78
-
79
-
80
-
81
-
82
-
83
-
84
-
85
-
86
-
87
-
88
-
89
-
90
-
91
-
92
-
93
-
94
-
95
-
96
-
97
-
98
-
99
-
100
-
101
-
102
-
103
-
104
-
105
-
106
-
107
-
108
-
109
-
110
-
111
-
112
-
113
-
114
-
115
-
116
-
117
-
118
-
119
-
120
-
121
-
122
-
123
-
124
-
125
-
126
-
127
-
128
-
129
-
130
-
131
-
132
-
133
-
134
-
135
-
136
-
137
-
138
-
139
-
140
-
141
-
142
-
143
-
144
-
145
-
146
-
147
-
148
-
149
-
150
-
151
-
152
 |
 |

CHARTER COMMUNICATIONS, INC. 2004 FORM 10-K
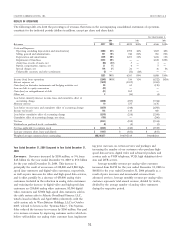
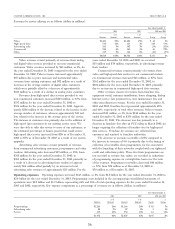
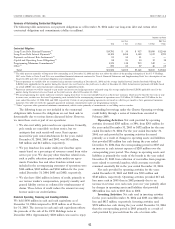
Revenues by service offering are as follows (dollars in millions):
Year Ended December 31,
2003 2002 2003 over 2002
% of % of %
Revenues Revenues Revenues Revenues Change Change
Video $3,461 72% $3,420 75% $ 41 1%
High-speed data 556 12% 337 7% 219 65%
Advertising sales 263 5% 302 7% (39) (13)%
Commercial 204 4% 161 3% 43 27%
Other 335 7% 346 8% (11) (3)%
$4,819 100% $4,566 100% $ 253 6%
Video revenues consist primarily of revenues from analog years ended December 31, 2003 and 2002, we received
and digital video services provided to our non-commercial $15 million and $79 million, respectively, in advertising revenue
customers. Video revenues increased by $41 million, or 1%, for from vendors.
the year ended December 31, 2003 compared to the year ended Commercial revenues consist primarily of revenues from
December 31, 2002. Video revenues increased approximately video and high-speed data services to our commercial custom-
$65 million due to price increases and incremental video ers. Commercial revenues increased $43 million, or 27%, from
revenues from existing customers and $82 million as a result of $161 million for the year ended December 31, 2002, to
increases in the average number of digital video customers, $204 million for the year ended December 31, 2003, primarily
which were partially offset by a decrease of approximately due to an increase in commercial high-speed data revenues.
$106 million as a result of a decline in analog video customers. Other revenues consist of revenues from franchise fees,
Revenues from high-speed data services provided to our equipment rental, customer installations, home shopping, dial-up
non-commercial customers increased $219 million, or 65%, from Internet service, late payment fees, wire maintenance fees and
$337 million for the year ended December 31, 2002 to other miscellaneous revenues. For the year ended December 31,
$556 million for the year ended December 31, 2003. Approxi- 2003 and 2002, franchise fees represented approximately 48%
mately $206 million of the increase related to the increase in the and 46%, respectively, of total other revenues. Other revenues
average number of customers, whereas approximately $13 mil- decreased $11 million, or 3%, from $346 million for the year
lion related to the increase in the average price of the service. ended December 31, 2002 to $335 million for the year ended
The increase in customers was primarily due to the addition of December 31, 2003. The decrease was due primarily to a
high-speed data customers in our existing service areas. We decrease in franchise fees after an FCC ruling in March 2002, no
were also able to offer this service to more of our customers, as longer requiring the collection of franchise fees for high-speed
the estimated percentage of homes passed that could receive data services . Franchise fee revenues are collected from
high-speed data service increased from 82% as of December 31, customers and remitted to franchise authorities.
2002 to 87% as of December 31, 2003 as a result of our system The decrease in accounts receivable of 27% compared to
upgrades. the increase in revenues of 6% is primarily due to the timing of
Advertising sales revenues consist primarily of revenues collection of receivables from programmers for fees associated
from commercial advertising customers, programmers and other with the launching of their networks coupled with our tightened
vendors. Advertising sales decreased $39 million, or 13%, from credit and collections policy. These fees from programmers are
$302 million for the year ended December 31, 2002, to not recorded as revenue but, rather, are recorded as reductions
$263 million for the year ended December 31, 2003 primarily as of programming expense on a straight-line basis over the term
a result of a decrease in advertising from vendors of approxi- of the contract. Programmer receivables decreased $40 million,
mately $64 million offset partially by an increase in local or 57%, from $70 million as of December 31, 2002 to
advertising sales revenues of approximately $25 million. For the $30 million as of December 31, 2003.
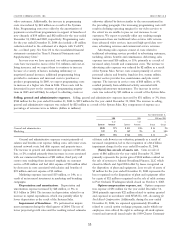
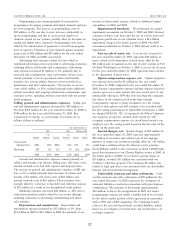
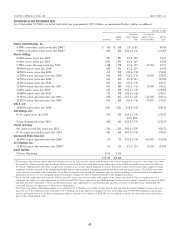
Operating expenses. Operating expenses increased $145 million, or 8%, from $1.8 billion for the year ended December 31, 2002 to
$2.0 billion for the year ended December 31, 2003. Programming costs included in the accompanying consolidated statements of
operations were $1.2 billion and $1.2 billion, representing 64% and 65% of total operating expenses for the years ended December 31,
2003 and 2002, respectively. Key expense components as a percentage of revenues are as follows (dollars in millions):
Year Ended December 31,
2003 2002 2003 over 2002
% of % of %
Expenses Revenues Expenses Revenues Change Change
Programming $1,249 26% $1,166 26% $ 83 7%
Advertising sales 88 2% 87 2% 1 1%
Service 615 12% 554 12% 61 11%
$1,952 40% $1,807 40% $145 8%
36