Charter 2007 Annual Report Download - page 42
Download and view the complete annual report
Please find page 42 of the 2007 Charter annual report below. You can navigate through the pages in the report by either clicking on the pages listed below, or by using the keyword search tool below to find specific information within the annual report.-
 1
1 -
2
-
3
-
4
-
5
-
6
-
7
-
8
-
9
-
10
-
11
-
12
-
13
-
14
-
15
-
16
-
17
-
18
-
19
-
20
-
21
-
22
-
23
-
24
-
25
-
26
-
27
-
28
-
29
-
30
-
31
-
 32
32 -
 33
33 -
 34
34 -
 35
35 -
 36
36 -
 37
37 -
 38
38 -
 39
39 -
 40
40 -
 41
41 -
 42
42 -
 43
43 -
 44
44 -
 45
45 -
 46
46 -
 47
47 -
 48
48 -
 49
49 -
 50
50 -
 51
51 -
 52
52 -
53
-
54
-
55
-
56
-
57
-
58
-
59
-
60
-
61
-
62
-
63
-
64
-
65
-
66
-
67
-
68
-
69
-
70
-
71
-
72
-
73
-
74
-
75
-
76
-
77
-
78
-
79
-
80
-
81
-
82
-
83
-
84
-
85
-
86
-
87
-
88
-
89
-
90
-
91
-
92
-
93
-
94
-
95
-
96
-
97
-
98
-
99
-
100
-
101
-
102
-
103
-
104
-
105
-
106
-
107
-
108
-
109
-
110
-
111
-
112
-
113
-
114
-
115
-
116
-
117
-
118
 |
 |

ITEM 7. MANAGEMENT’S DISCUSSION AND ANALYSIS OF FINANCIAL CONDITION AND RESULTS OF
OPERATIONS.
Reference is made to ‘Item 1A. Risk Factors‘ and ‘Cautionary
Statement Regarding Forward-Looking Statements,‘ which
describe important factors that could cause actual results to differ
from expectations and non-historical information contained
herein. In addition, the following discussion should be read in
conjunction with the audited consolidated financial statements of
Charter Communications, Inc. and subsidiaries as of and for the
years ended December 31, 2007, 2006, and 2005.
Overview
Charter is a broadband communications company operating in
the United States, with approximately 5.6 million customers at
December 31, 2007. Through our hybrid fiber and coaxial cable
network, we offer our customers traditional cable video program-
ming (analog and digital, which we refer to as “video” service),
high-speed Internet access, and telephone services, as well as,
advanced broadband services (such as OnDemand, high defini-
tion television service and DVR). See “Item 1. Business – Prod-
ucts and Services” for further description of these terms,
including “customers.”
Approximately 89% and 88% of our revenues for each of the
years ended December 31, 2007 and 2006, respectively, are
attributable to monthly subscription fees charged to customers
for our video, high-speed Internet, telephone, and commercial
services provided by our cable systems. Generally, these cus-
tomer subscriptions may be discontinued by the customer at any
time. The remaining 11% and 12% of revenue is derived prima-
rily from advertising revenues, franchise fee revenues (which are
collected by us but then paid to local franchising authorities),
pay-per-view and OnDemand programming (where users are
charged a fee for individual programs viewed), installation or
reconnection fees charged to customers to commence or rein-
state service, and commissions related to the sale of merchandise
by home shopping services.
The cable industry’s and our most significant competitive
challenges stem from DBS providers and DSL service providers.
In addition, telephone companies either offer or are making
upgrades of their networks that will allow them to offer services
that provide features and functions similar to our video, high-
speed Internet, and telephone services, and they also offer them
in bundles similar to ours. See “Item 1. Business – Competition.”
We believe that competition from DBS and telephone companies
has resulted in net video customer losses. In addition, we face
increasingly limited opportunities to expand our customer base
now that approximately 56% of our video customers subscribe to
our digital video service. These factors have contributed to
decreased growth rates for digital video customers. Similarly,
competition from DSL providers along with increasing penetra-
tion of high-speed Internet service in homes with computers has
resulted in decreased growth rates for high-speed Internet cus-
tomers. In the recent past, we have grown revenues by offsetting
video customer losses with price increases and sales of incremen-
tal services such as high-speed Internet, OnDemand, DVR, high
definition television, and telephone. We expect to continue to
grow revenues through price increases and high-speed Internet
upgrades, increases in the number of our customers who pur-
chase bundled services including high-speed Internet and tele-
phone, and through sales of incremental video services including
wireless networking, high definition television, OnDemand, and
DVR service. In addition, we expect to increase revenues by
expanding the sales of our services to our commercial customers.
However, we cannot assure you that we will be able to grow
revenues at historical rates, if at all.
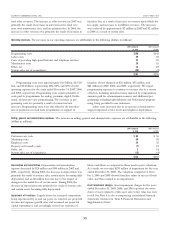
Our expenses primarily consist of operating costs, selling,
general and administrative expenses, depreciation and amortiza-
tion expense and interest expense. Operating costs primarily
include programming costs, the cost of our workforce, cable
service related expenses, advertising sales costs and franchise fees.
Selling, general and administrative expenses primarily include
salaries and benefits, rent expense, billing costs, call center costs,
internal network costs, bad debt expense, and property taxes. We
are attempting to control our costs of operations by maintaining
strict controls on expenses. More specifically, we are focused on
managing our cost structure by improving workforce productiv-
ity, and leveraging our growth, and increasing the effectiveness of
our purchasing activities.
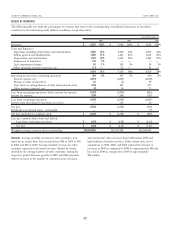
Our operating income from continuing operations increased
to $548 million for the year ended December 31, 2007 from
$367 million for the year ended December 31, 2006 and $304 mil-
lion for the year ended December 31, 2005. We had positive
operating margins (defined as operating income from continuing
operations divided by revenues) of 9%, 7%, and 6% for the years
ended December 31, 2007, 2006, and 2005, respectively. The
improvement in operating income from continuing operations
and operating margin for the years ended December 31, 2007,
2006, and 2005 is principally due to an increase in revenue over
expenses as a result of increased customers for high-speed
Internet, digital video, and telephone customers, as well as overall
rate increases.
We have a history of net losses. Further, we expect to
continue to report net losses for the foreseeable future. Our net
losses are principally attributable to insufficient revenue to cover
the combination of operating expenses and interest expenses we
incur because of our high amounts of debt, and depreciation
expenses resulting from the capital investments we have made
and continue to make in our cable properties. We expect that
these expenses will remain significant.
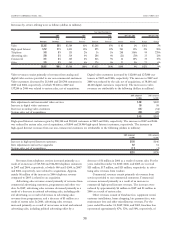
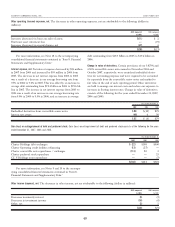
Beginning in 2004 and continuing through 2007, we sold
several cable systems to divest geographically non-strategic assets
and allow for more efficient operations, while also reducing debt
or increasing our liquidity. In 2005, 2006, and 2007, we closed
the sale of certain cable systems representing a total of approxi-
mately 33,000, 390,300, and 85,100 video customers, respectively.
As a result of these sales we have improved our geographic
footprint by reducing our number of headends, increasing the
number of customers per headend, and reducing the number of
states in which the majority of our customers reside. We have
CHARTER COMMUNICATIONS, INC. 2007 FORM 10-K
31