Charter 2007 Annual Report Download - page 50
Download and view the complete annual report
Please find page 50 of the 2007 Charter annual report below. You can navigate through the pages in the report by either clicking on the pages listed below, or by using the keyword search tool below to find specific information within the annual report.-
 1
1 -
2
-
3
-
4
-
5
-
6
-
7
-
8
-
9
-
10
-
11
-
12
-
13
-
14
-
15
-
16
-
17
-
18
-
19
-
20
-
21
-
22
-
23
-
24
-
25
-
26
-
27
-
28
-
29
-
30
-
31
-
32
-
33
-
34
-
35
-
36
-
37
-
38
-
39
-
 40
40 -
 41
41 -
 42
42 -
 43
43 -
 44
44 -
 45
45 -
 46
46 -
 47
47 -
 48
48 -
 49
49 -
 50
50 -
 51
51 -
 52
52 -
 53
53 -
 54
54 -
 55
55 -
 56
56 -
 57
57 -
 58
58 -
 59
59 -
 60
60 -
61
-
62
-
63
-
64
-
65
-
66
-
67
-
68
-
69
-
70
-
71
-
72
-
73
-
74
-
75
-
76
-
77
-
78
-
79
-
80
-
81
-
82
-
83
-
84
-
85
-
86
-
87
-
88
-
89
-
90
-
91
-
92
-
93
-
94
-
95
-
96
-
97
-
98
-
99
-
100
-
101
-
102
-
103
-
104
-
105
-
106
-
107
-
108
-
109
-
110
-
111
-
112
-
113
-
114
-
115
-
116
-
117
-
118
 |
 |

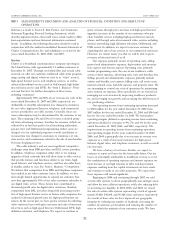
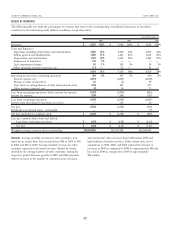
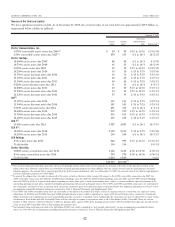
total other revenues. The increase in other revenues in 2007 was
primarily the result of increases in universal service fund reve-
nues, wire maintenance fees, and late payment fees. In 2006, the
increase in other revenues was primarily the result of increases in
franchise fees as a result of increases in revenues upon which the
fees apply, and increases in installation revenues. The increases
were reduced by approximately $7 million in 2007 and $2 million
in 2006 as a result of system sales.
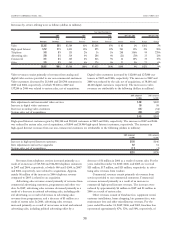
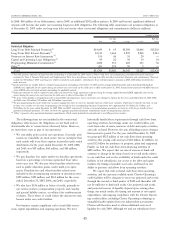
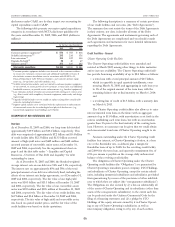
Operating expenses. The increases in our operating expenses are attributable to the following (dollars in millions):
2007 compared
to 2006
2006 compared
to 2005
Programming costs $106 $143
Labor costs 49 32
Costs of providing high-speed Internet and telephone services 33 25
Maintenance costs 20 15
Other, net 23 27
System sales, net of acquisitions (49) (7)
$182 $235
Programming costs were approximately $1.6 billion, $1.5 bil-
lion, and $1.4 billion, representing 60%, 61%, and 62% of total
operating expenses for the years ended December 31, 2007, 2006,
and 2005, respectively. Programming costs consist primarily of
costs paid to programmers for analog, premium, digital, OnDe-
mand, and pay-per-view programming. The increases in pro-
gramming costs are primarily a result of contractual rate
increases. Programming costs were also offset by the amortiza-
tion of payments received from programmers in support of
launches of new channels of $22 million, $32 million, and
$41 million in 2007, 2006, and 2005, respectively. We expect
programming expenses to continue to increase due to a variety
of factors, including annual increases imposed by programmers,
amounts paid for retransmission consent, and additional pro-
gramming, including high-definition and OnDemand program-
ming, being provided to our customers.
Labor costs increased due to an increase in headcount to
support improved service levels and telephone deployment.
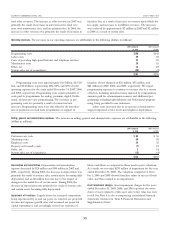
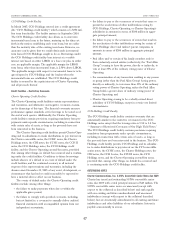
Selling, general and administrative expenses. The increases in selling, general and administrative expenses are attributable to the following
(dollars in millions):
2007 compared
to 2006
2006 compared
to 2005
Customer care costs $62 $56
Marketing costs 58 38
Employee costs 24 32
Property and casualty costs (7) 17
Other, net 214
System sales, net of acquisitions (15) (4)
$124 $153
Depreciation and amortization. Depreciation and amortization
expense decreased by $26 million and $89 million in 2007 and
2006, respectively. During 2007, the decrease in depreciation was
primarily the result of systems sales, certain assets becoming fully
depreciated, and an $8 million decrease due to the impact of
changes in the useful lives of certain assets. During 2006, the
decrease in depreciation was primarily the result of systems sales
and certain assets becoming fully depreciated.
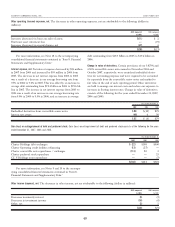
Impairment of franchises. Largely driven by increased competition
being experienced by us and our peers, we lowered our projected
revenue and expense growth rates and increased our projected
capital expenditures, and accordingly revised our estimates of
future cash flows as compared to those used in prior valuations.
As a result, we recorded $178 million of impairment for the year
ended December 31, 2007. The valuations completed at Octo-
ber 1, 2006 and 2005 showed franchise values in excess of book
value, and thus resulted in no impairments.
Asset impairment charges. Asset impairment charges for the years
ended December 31, 2007, 2006, and 2005 represent the write-
down of assets related to cable asset sales to fair value less costs
to sell. See Note 4 to the accompanying consolidated financial
statements contained in “Item 8. Financial Statements and
Supplementary Data.”
CHARTER COMMUNICATIONS, INC. 2007 FORM 10-K
39