Charter 2007 Annual Report Download - page 48
Download and view the complete annual report
Please find page 48 of the 2007 Charter annual report below. You can navigate through the pages in the report by either clicking on the pages listed below, or by using the keyword search tool below to find specific information within the annual report.-
 1
1 -
2
-
3
-
4
-
5
-
6
-
7
-
8
-
9
-
10
-
11
-
12
-
13
-
14
-
15
-
16
-
17
-
18
-
19
-
20
-
21
-
22
-
23
-
24
-
25
-
26
-
27
-
28
-
29
-
30
-
31
-
32
-
33
-
34
-
35
-
36
-
37
-
 38
38 -
 39
39 -
 40
40 -
 41
41 -
 42
42 -
 43
43 -
 44
44 -
 45
45 -
 46
46 -
 47
47 -
 48
48 -
 49
49 -
 50
50 -
 51
51 -
 52
52 -
 53
53 -
 54
54 -
 55
55 -
 56
56 -
 57
57 -
 58
58 -
59
-
60
-
61
-
62
-
63
-
64
-
65
-
66
-
67
-
68
-
69
-
70
-
71
-
72
-
73
-
74
-
75
-
76
-
77
-
78
-
79
-
80
-
81
-
82
-
83
-
84
-
85
-
86
-
87
-
88
-
89
-
90
-
91
-
92
-
93
-
94
-
95
-
96
-
97
-
98
-
99
-
100
-
101
-
102
-
103
-
104
-
105
-
106
-
107
-
108
-
109
-
110
-
111
-
112
-
113
-
114
-
115
-
116
-
117
-
118
 |
 |

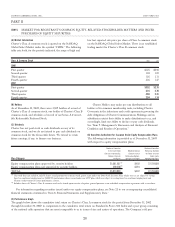
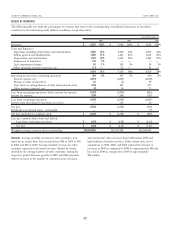
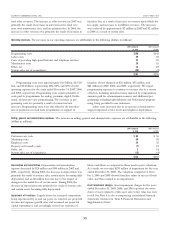
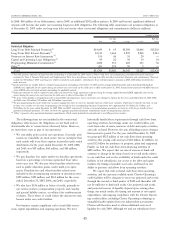
RESULTS OF OPERATIONS
The following table sets forth the percentages of revenues that items in the accompanying consolidated statements of operations
constitute for the indicated periods (dollars in millions, except share data):
2007 2006 2005
Year Ended December 31,
Revenues $ 6,002 100% $ 5,504 100% $ 5,033 100%
Costs and Expenses:
Operating (excluding depreciation and amortization) 2,620 44% 2,438 44% 2,203 44%
Selling, general and administrative 1,289 21% 1,165 21% 1,012 20%
Depreciation and amortization 1,328 22% 1,354 25% 1,443 29%
Impairment of franchises 178 3% — — — —
Asset impairment charges 56 1% 159 3% 39 1%
Other operating (income) expenses, net (17) — 21 —32 —
5,454 91% 5,137 93% 4,729 94%
Operating income from continuing operations 548 9% 367 7% 304 6%
Interest expense, net (1,851) (1,877) (1,818)
Change in value of derivatives 52 (4) 79
Gain (loss) on extinguishment of debt and preferred stock (148) 101 521
Other income (expense), net (8) 14 23
Loss from continuing operations, before income tax expense (1,407) (1,399) (891)
Income tax expense (209) (187) (112)
Loss from continuing operations (1,616) (1,586) (1,003)
Income from discontinued operations, net of tax —216 36
Net loss (1,616) (1,370) (967)
Dividends on preferred stock – redeemable —— (3)
Net loss applicable to common stock $ (1,616) $ (1,370) $ (970)
Loss per common share, basic and diluted:
Loss from continuing operations $ (4.39) $ (4.78) $ (3.24)
Net loss $ (4.39) $ (4.13) $ (3.13)
Weighted average common shares outstanding 368,240,608 331,941,788 310,209,047
Revenues. Average monthly revenue per video customer, mea-
sured on an annual basis, has increased from $74 in 2005 to $82
in 2006 and $93 in 2007. Average monthly revenue per video
customer represents total annual revenue, divided by twelve,
divided by the average number of video customers during the
respective period. Revenue growth in 2007 and 2006 primarily
reflects increases in the number of customers, price increases,
and incremental video revenues from OnDemand, DVR and
high-definition television services. Cable system sales, net of
acquisitions, in 2005, 2006, and 2007 reduced the increase in
revenues in 2007 as compared to 2006 by approximately $90 mil-
lion and in 2006 as compared to 2005 by approximately
$24 million.
CHARTER COMMUNICATIONS, INC. 2007 FORM 10-K
37