Charter 2007 Annual Report Download - page 49
Download and view the complete annual report
Please find page 49 of the 2007 Charter annual report below. You can navigate through the pages in the report by either clicking on the pages listed below, or by using the keyword search tool below to find specific information within the annual report.-
 1
1 -
2
-
3
-
4
-
5
-
6
-
7
-
8
-
9
-
10
-
11
-
12
-
13
-
14
-
15
-
16
-
17
-
18
-
19
-
20
-
21
-
22
-
23
-
24
-
25
-
26
-
27
-
28
-
29
-
30
-
31
-
32
-
33
-
34
-
35
-
36
-
37
-
38
-
 39
39 -
 40
40 -
 41
41 -
 42
42 -
 43
43 -
 44
44 -
 45
45 -
 46
46 -
 47
47 -
 48
48 -
 49
49 -
 50
50 -
 51
51 -
 52
52 -
 53
53 -
 54
54 -
 55
55 -
 56
56 -
 57
57 -
 58
58 -
 59
59 -
60
-
61
-
62
-
63
-
64
-
65
-
66
-
67
-
68
-
69
-
70
-
71
-
72
-
73
-
74
-
75
-
76
-
77
-
78
-
79
-
80
-
81
-
82
-
83
-
84
-
85
-
86
-
87
-
88
-
89
-
90
-
91
-
92
-
93
-
94
-
95
-
96
-
97
-
98
-
99
-
100
-
101
-
102
-
103
-
104
-
105
-
106
-
107
-
108
-
109
-
110
-
111
-
112
-
113
-
114
-
115
-
116
-
117
-
118
 |
 |

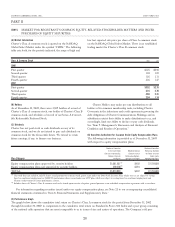
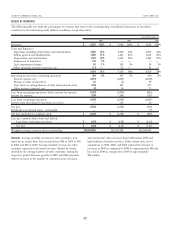
Revenues by service offering were as follows (dollars in millions):
Revenues
%of
Revenues Revenues
%of
Revenues Revenues
%of
Revenues Change
%
Change Change
%
Change
2007 2006 2005 2007 over 2006 2006 over 2005
Year Ended December 31,
Video $3,392 56% $3,349 61% $3,248 65% $ 43 1% $101 3%
High-speed Internet 1,252 21% 1,051 19% 875 17% 201 19% 176 20%
Telephone 343 6% 135 2% 36 1% 208 154% 99 275%
Advertising sales 298 5% 319 6% 284 6% (21) (7)% 35 12%
Commercial 341 6% 305 6% 266 5% 36 12% 39 15%
Other 376 6% 345 6% 324 6% 31 9% 21 6%
$6,002 100% $5,504 100% $5,033 100% $498 9% $471 9%
Video revenues consist primarily of revenues from analog and
digital video services provided to our non-commercial customers.
Video customers decreased by 213,400 and 210,700 customers in
2007 and 2006, respectively, of which 97,100 in 2007 and
137,200 in 2006 was related to system sales, net of acquisitions.
Digital video customers increased by 112,000 and 127,800 cus-
tomers in 2007 and 2006, respectively. The increase in 2007 and
2006 was reduced by the sale, net of acquisitions, of 38,100 and
42,100 digital customers, respectively. The increases in video
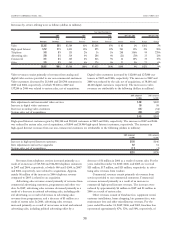
revenues are attributable to the following (dollars in millions):
2007 compared
to 2006
2006 compared
to 2005
Rate adjustments and incremental video services $88 $102
Increase in digital video customers 59 58
Decrease in analog video customers (41) (34)
System sales, net of acquisitions (63) (25)
$43 $101
High-speed Internet customers grew by 280,300 and 283,600 customers in 2007 and 2006, respectively. The increase in 2007 and 2006
was reduced by system sales, net of acquisitions, of 8,800 and 20,900 high-speed Internet customers, respectively. The increases in
high-speed Internet revenues from our non-commercial customers are attributable to the following (dollars in millions):
2007 compared
to 2006
2006 compared
to 2005
Increase in high-speed Internet customers $150 $146
Rate adjustments and service upgrades 62 31
System sales, net of acquisitions (11) (1)
$201 $176
Revenues from telephone services increased primarily as a
result of an increase of 513,500 and 324,300 telephone customers
in 2007 and 2006, respectively, of which 500 and 14,500, in 2007
and 2006, respectively, were related to acquisitions. Approxi-
mately $6 million of the increase in 2006 telephone revenue
compared to 2005 is related to an acquisition.
Advertising sales revenues consist primarily of revenues from
commercial advertising customers, programmers and other ven-
dors. In 2007, advertising sales revenues decreased primarily as a
result of a decrease in national advertising sales, including polit-
ical advertising, as a result of decreases in advertising sales
revenues from programmers, and a decrease of $3 million as a
result of system sales. In 2006, advertising sales revenues
increased primarily as a result of an increase in local and national
advertising sales, including political advertising offset by a
decrease of $1 million in 2006 as a result of system sales. For the
years ended December 31, 2007, 2006, and 2005, we received
$13 million, $17 million, and $15 million, respectively, in adver-
tising sales revenues from vendors.
Commercial revenues consist primarily of revenues from
services provided to our commercial customers. Commercial
revenues increased primarily as a result of an increase in
commercial high-speed Internet revenues. The increases were
reduced by approximately $6 million in 2007 and $1 million in
2006 as a result of system sales.
Other revenues consist of franchise fees, equipment rental,
customer installations, home shopping, late payment fees, wire
maintenance fees and other miscellaneous revenues. For the
years ended December 31, 2007, 2006, and 2005, franchise fees
represented approximately 47%, 52%, and 54%, respectively, of
CHARTER COMMUNICATIONS, INC. 2007 FORM 10-K
38