Charter 2007 Annual Report Download - page 90
Download and view the complete annual report
Please find page 90 of the 2007 Charter annual report below. You can navigate through the pages in the report by either clicking on the pages listed below, or by using the keyword search tool below to find specific information within the annual report.-
 1
1 -
2
-
3
-
4
-
5
-
6
-
7
-
8
-
9
-
10
-
11
-
12
-
13
-
14
-
15
-
16
-
17
-
18
-
19
-
20
-
21
-
22
-
23
-
24
-
25
-
26
-
27
-
28
-
29
-
30
-
31
-
32
-
33
-
34
-
35
-
36
-
37
-
38
-
39
-
40
-
41
-
42
-
43
-
44
-
45
-
46
-
47
-
48
-
49
-
50
-
51
-
52
-
53
-
54
-
55
-
56
-
57
-
58
-
59
-
60
-
61
-
62
-
63
-
64
-
65
-
66
-
67
-
68
-
69
-
70
-
71
-
72
-
73
-
74
-
75
-
76
-
77
-
78
-
79
-
 80
80 -
 81
81 -
 82
82 -
 83
83 -
 84
84 -
 85
85 -
 86
86 -
 87
87 -
 88
88 -
 89
89 -
 90
90 -
 91
91 -
 92
92 -
 93
93 -
 94
94 -
 95
95 -
 96
96 -
 97
97 -
 98
98 -
 99
99 -
 100
100 -
101
-
102
-
103
-
104
-
105
-
106
-
107
-
108
-
109
-
110
-
111
-
112
-
113
-
114
-
115
-
116
-
117
-
118
 |
 |

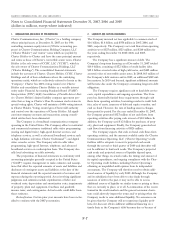
Loss per Common Share
Basic loss per common share is computed by dividing the net
loss applicable to common stock by 368,240,608 shares,
331,941,788 shares, and 310,209,047 shares for the years ended
December 31, 2007, 2006, and 2005, representing the weighted-
average common shares outstanding during the respective peri-
ods. Diluted loss per common share equals basic loss per
common share for the periods presented, as the effect of stock
options and other convertible securities are antidilutive because
the Company incurred net losses. All membership units of
Charter Holdco are exchangeable on a one-for-one basis into
common stock of Charter at the option of the holders. As of
December 31, 2007, Charter Holdco had 737,408,499 member-
ship units outstanding. Should the holders exchange units for
shares, the effect would not be dilutive to earnings per share
because the Company incurred net losses.
The 24.8 million and 39.8 million shares outstanding as of
December 31, 2007 and 2006, respectively, pursuant to the share
lending agreement described in Note 13 are required to be
returned, in accordance with the contractual arrangement, and
are treated in basic and diluted earnings per share as if they were
already returned and retired. Consequently, there is no impact of
the shares of common stock lent under the share lending
agreement in the earnings per share calculation.
Segments
SFAS No. 131, Disclosure about Segments of an Enterprise and
Related Information, established standards for reporting informa-
tion about operating segments in annual financial statements and
in interim financial reports issued to shareholders. Operating
segments are defined as components of an enterprise about
which separate financial information is available that is evaluated
on a regular basis by the chief operating decision maker, or
decision making group, in deciding how to allocate resources to
an individual segment and in assessing performance of the
segment.
The Company’s operations are managed on the basis of
geographic divisional operating segments. The Company has
evaluated the criteria for aggregation of the geographic operating
segments under paragraph 17 of SFAS No. 131 and believes it
meets each of the respective criteria set forth. The Company
delivers similar products and services within each of its geo-
graphic divisional operations. Each geographic and divisional
service area utilizes similar means for delivering the programming
of the Company’s services; have similarity in the type or class of
customer receiving the products and services; distributes the
Company’s services over a unified network; and operates within
a consistent regulatory environment. In addition, each of the
geographic divisional operating segments has similar economic
characteristics. In light of the Company’s similar services, means
for delivery, similarity in type of customers, the use of a unified
network and other considerations across its geographic divisional
operating structure, management has determined that the Com-
pany has one reportable segment, broadband services.
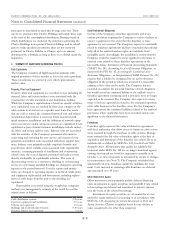
4. SALE OF ASSETS
In 2006, the Company sold certain cable television systems
serving approximately 356,000 video customers in 1) West Vir-
ginia and Virginia to Cebridge Connections, Inc. (the “Cebridge
Transaction”); 2) Illinois and Kentucky to Telecommunications
Management, LLC, doing business as New Wave Communica-
tions (the “New Wave Transaction”) and 3) Nevada, Colorado,
New Mexico and Utah to Orange Broadband Holding Company,
LLC (the “Orange Transaction”) for a total sales price of
approximately $971 million. The Company used the net pro-
ceeds from the asset sales to reduce borrowings, but not commit-
ments, under the revolving portion of the Company’s credit
facilities. These cable systems met the criteria for assets held for
sale. As such, the assets were written down to fair value less
estimated costs to sell, resulting in asset impairment charges
during the year ended December 31, 2006 of approximately
$99 million related to the New Wave Transaction and the
Orange Transaction. The Company determined that the West
Virginia and Virginia cable systems comprise operations and cash
flows that for financial reporting purposes meet the criteria for
discontinued operations. Accordingly, the results of operations
for the West Virginia and Virginia cable systems have been
presented as discontinued operations, net of tax, for the year
ended December 31, 2006, including a gain of $200 million on
the sale of cable systems.
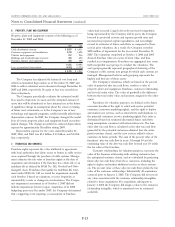
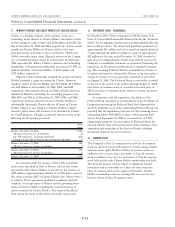
Summarized consolidated financial information for the years
ended December 31, 2006 and 2005 for the West Virginia and
Virginia cable systems is as follows:
2006 2005
Year Ended
December 31,
Revenues $ 109 $ 221
Income before income taxes $ 238 $ 39
Income tax expense $ (22) $ (3)
Net income $ 216 $ 36
Earnings per common share, basic and diluted $0.65 $0.12
In 2007, 2006, and 2005, the Company recorded asset
impairment charges of $56 million, $60 million, and $39 million,
respectively, related to other cable systems meeting the criteria
of assets held for sale.
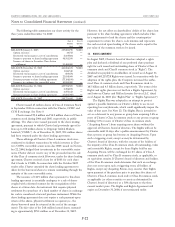
5. ALLOWANCE FOR DOUBTFUL ACCOUNTS
Activity in the allowance for doubtful accounts is summarized as
follows for the years presented:
2007 2006 2005
Year Ended December 31,
Balance, beginning of year $16 $17 $15
Charged to expense 107 89 76
Uncollected balances written off, net of recoveries (105) (90) (74)
Balance, end of year $18 $16 $17
F-12
CHARTER COMMUNICATIONS, INC. AND SUBSIDIARIES 2007 FORM 10-K
Notes to Consolidated Financial Statements (continued)