Lowe's 1998 Annual Report Download - page 17
Download and view the complete annual report
Please find page 17 of the 1998 Lowe's annual report below. You can navigate through the pages in the report by either clicking on the pages listed below, or by using the keyword search tool below to find specific information within the annual report.-
 1
1 -
2
-
3
-
4
-
5
-
6
-
 7
7 -
 8
8 -
 9
9 -
 10
10 -
 11
11 -
 12
12 -
 13
13 -
 14
14 -
 15
15 -
 16
16 -
 17
17 -
 18
18 -
 19
19 -
 20
20 -
 21
21 -
 22
22 -
 23
23 -
 24
24 -
 25
25 -
 26
26 -
 27
27 -
28
-
29
-
30
-
31
-
32
-
33
-
34
-
35
-
36
-
37
-
38
-
39
-
40
 |
 |
Management’s Discussion and Analysis of Financial Condition and Results of Operations
This discussion summarizes the significant factors affecting the Company’s consolidated operating results and liquidity and capital
resources during the three-year period ended January 29, 1999 (i.e., fiscal 1998, 1997 and 1996). This discussion should be read in
conjunction with the Letter to Shareholders, financial statements and financial statement footnotes included in this annual report.
OPERATIONS
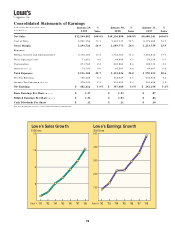
Net earnings for 1998 increased 35% to $482.4 million or 3.9% of sales compared to $357.5 million or 3.5% of sales for 1997.
Net earnings, calculated on a FIFO basis, would show an increase of 31% for 1998. Diluted earnings per share were $1.36 for 1998
compared to $1.03 for 1997 and $.86 for 1996. Return on beginning assets was 9.2% for 1998 compared to 8.1% for 1997; and return
on beginning shareholders’ equity was 18.6% for 1998 compared to 16.1% for 1997.
The Company’s sales were $12.2 billion in 1998, a 21% increase over 1997 sales of $10.1 billion. Sales for 1997 were 18%
higher than 1996 levels. Comparable store sales increased 6% in 1998 and large store (stores exceeding 80,000 square feet)
comparable sales increased 7% for the year. The increases in sales are attributable to the Company’s ongoing store expansion and
relocation program along with the growth in comparable store sales. Comparable store sales increases are driven by the Company’s
continued strategy of employing an expanded inventory assortment, everyday competitive prices, and an emphasis on customer
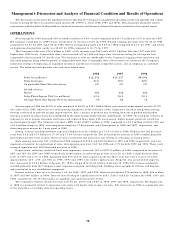
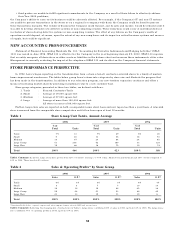
service. The following table presents sales and store information:
1998 1997 1996
Sales (in millions) $12,245 $10,137 $8,600
Sales Increases 21% 18% 22%
Comparable Store Sales Increases 6% 4% 7%
At end of year:
Stores 484 446 402
Sales Floor Square Feet (in millions) 43.4 36.5 30.4
Average Store Size Square Feet (in thousands) 90 82 76
Gross margin in 1998 was 26.9% of sales compared to 26.5% in 1997. Both of these years showed improvement over the 25.9%
rate achieved in 1996. Adherence to careful pricing disciplines in the execution of the Company’s everyday competitive pricing
strategy continued to provide margin improvements. Also, changes in product mix resulting from the expanded merchandise
selection available in larger stores has contributed to the gross margin improvements. Additionally, in 1996, the Company reduced its
exposure in lower margin consumer electronics and replaced these items with less seasonal, higher margin, products, which has
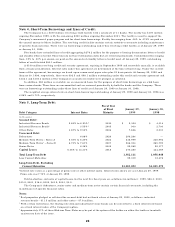
increased gross margin. The Company recorded a LIFO credit of $29.0 million in 1998, compared to a $7.0 million credit in 1997 and
a $1.4 million charge in 1996, increasing gross margin by 17 basis points and 6 basis points in 1998 and 1997, respectively, and
decreasing gross margin by 1 basis point in 1996.
Selling, General and Administrative expenses (SG& A) were $2.1 billion or 17.3% of sales in 1998. SG&A in the two previous
years were $1.8 and $1.5 billion or 17.3% and 17.0% of sales, respectively. The 30 basis point increase in 1997 resulted primarily
from higher payroll levels at stores that were new or relocated and increased costs relating to relocating or closing stores.
Store opening costs were $71.7 million for 1998 compared to $70.0 and $59.2 million in 1997 and 1996, respectively, and were
expensed as incurred. As a percentage of sales, store opening costs were 0.6% for 1998 and 0.7% for both 1997 and 1996. These c osts
averaged approximately $900 thousand per store in 1998.
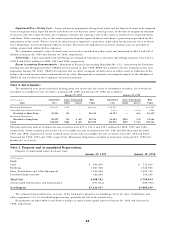
Depreciation, reflecting continued fixed asset expansion, increased 13% to $271.8 million in 1998, compared to increases of
22% and 32% for 1997 and 1996, respectively. Depreciation as a percentage of sales was 2.2% in 1998, a slight decrease from
2.4% in 1997 and 2.3% in 1996. Approximately 39% of new stores opened in the last three years have been leased, of which
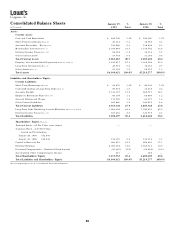
approximately 44%, 30% and 93% in 1998, 1997 and 1996 were under capital leases. Property, less accumulated deprecia-
tion, increased to $3.64 billion at January 29, 1999 compared to $3.01 billion at January 30, 1998. The increase in property
resulted primarily from the Company’s store expansion program, including land, building, store equipment, fixtures and displays,
and investment in new distribution equipment.
Interest costs as a percent of sales were 0.6% for 1998, 1997 and 1996. Interest costs totaled $75 million in 1998, $66 million
in 1997 and $49 million in 1996. Interest costs relating to capital leases were $39.1, $38.3 and $29.1 million for 1998, 1997 and
1996, respectively. See the discussion on liquidity and capital resources below.
The Company’s effective income tax rates were 36.4%, 36.0% and 35.6% in 1998, 1997 and 1996, respectively. The higher rate
in 1998 was primarily related to expansion into states with higher state income tax rates. The lower rate in 1996 was primarily due
to the utilization of available state net operating losses.
15