Lowe's 1998 Annual Report Download - page 36
Download and view the complete annual report
Please find page 36 of the 1998 Lowe's annual report below. You can navigate through the pages in the report by either clicking on the pages listed below, or by using the keyword search tool below to find specific information within the annual report.-
 1
1 -
2
-
3
-
4
-
5
-
6
-
7
-
8
-
9
-
10
-
11
-
12
-
13
-
14
-
15
-
16
-
17
-
18
-
19
-
20
-
21
-
22
-
23
-
24
-
25
-
 26
26 -
 27
27 -
 28
28 -
 29
29 -
 30
30 -
 31
31 -
 32
32 -
 33
33 -
 34
34 -
 35
35 -
 36
36 -
 37
37 -
 38
38 -
 39
39 -
 40
40
 |
 |

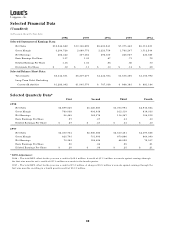
Earnings Statement
In Thousands, Except Per Share Data
Quarter Ended 1/29/99 10/30/98 7/31/98 5/1/98 1/30/98 10/31/97 8/1/97 5/2/97
Earnings Statement Changes
Changes from Same Quarter Previous Year, to Nearest Tenth Percent
Quarter Ended 1/29/99 10/30/98 7/31/98 5/1/98 1/30/98 10/31/97 8/1/97 5/2/97
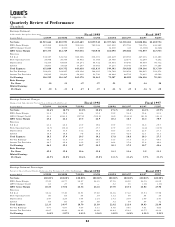
Quarterly Review of Performance
Net Sales $2,915,664 $3,003,993 $3,425,685 $2,899,540 $2,397,568 $2,530,481 $2,808,086 $2,400,754
FIFO Gross Margin 801,425 804,219 900,036 760,038 651,590 670,755 734,178 626,249
LIFO (Charge) Credit 17,908 8,100 3,000 — 12,500 131 (3,085) (2,546)
LIFO Gross Margin 819,333 812,319 903,036 760,038 664,090 670,886 731,093 623,703
Expenses:
S,G & A 534,187 522,723 545,166 516,073 440,229 435,765 447,303 431,480
Store Opening Costs 24,988 20,345 14,952 11,365 26,788 22,671 12,289 8,252
Depreciation 72,104 68,660 66,273 64,732 65,053 60,546 58,569 56,712
Interest 19,801 18,024 17,247 19,663 17,231 15,046 16,005 17,286
Total Expenses 651,080 629,752 643,638 611,833 549,301 534,028 534,166 513,730
Pre-Tax Earnings 168,253 182,567 259,398 148,205 114,789 136,858 196,927 109,973
Income Tax Provision 62,041 66,200 94,020 53,740 42,282 48,759 70,431 39,590
Net Earnings 106,212 116,367 165,378 94,465 72,507 88,099 126,496 70,383
Basic Earnings
Per Share .30 .33 .47 .27 .21 .25 .36 .20
Diluted Earnings
Per Share $ .30 $ .33 $ .47 $ .27 $ .21 $ .25 $ .36 $ .20
Fiscal 1997
Fiscal 1997
Net Sales 21.6% 18.7% 22.0% 20.8% 17.4% 15.4% 14.2% 25.9%
FIFO Gross Margin 23.0 19.9 22.6 21.4 19.9 18.4 15.8 30.2
LIFO (Charge) Credit 43.3 6083.2 (197.2) (100.0) 38.0 (126.2) (43.5) (43.3)
LIFO Gross Margin 23.4 21.1 23.5 21.9 20.2 18.5 16.3 30.9
Expenses:
S,G & A 21.3 20.0 21.9 19.6 15.9 17.0 18.0 29.7
Store Opening Costs (6.7) (10.3) 21.7 37.7 47.9 41.7 (2.2) (33.9)
Depreciation 10.8 13.4 13.2 14.1 18.3 19.3 22.6 27.1
Interest 14.9 19.8 7.8 13.8 30.3 42.8 32.1 31.1
Total Expenses 18.5 17.9 20.5 19.1 17.8 18.8 18.3 27.5
Pre-Tax Earnings 46.6 33.4 31.7 34.8 33.3 17.4 11.0 49.6
Income Tax Provision 46.7 35.8 33.5 35.7 38.6 17.8 11.6 49.6
Net Earnings 46.5 32.1 30.7 34.2 30.3 17.2 10.7 49.6
Basic Earnings
Per Share 42.9 32.0 30.6 35.0 31.3 13.6 2.9 33.3
Diluted Earnings
Per Share 42.9% 32.0% 30.6% 35.0% 31.3% 13.6% 5.9% 33.3%
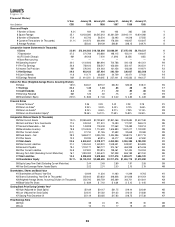
Earnings Statement Percentages
Percent of Sales to Nearest Hundredth; Income Tax Provision is % of Pre-Tax Earnings
Quarter Ended 1/29/99 10/30/98 7/31/98 5/1/98 1/30/98 10/31/97 8/1/97 5/2/97
Fiscal 1997Fiscal 1998
Net Sales 100.00% 100.00% 100.00% 100.00% 100.00% 100.00% 100.00% 100.00%
FIFO Gross Margin 27.49 26.77 26.27 26.21 27.18 26.50 26.15 26.09
LIFO (Charge) Credit .61 .27 .09 .— .52 .01 (.11) (.11)
LIFO Gross Margin 28.10 27.04 26.36 26.21 27.70 26.51 26.04 25.98
Expenses:
S,G & A 18.32 17.40 15.91 17.80 18.36 17.22 15.93 17.98
Store Opening Costs .86 .68 .44 .39 1.12 .90 .44 .34
Depreciation 2.47 2.29 1.94 2.23 2.72 2.39 2.09 2.36
Interest .68 .60 .50 .68 .72 .59 .57 .72
Total Expenses 22.33 20.97 18.79 21.10 22.92 21.10 19.03 21.40
Pre-Tax Earnings 5.77 6.07 7.57 5.11 4.78 5.41 7.01 4.58
Income Tax Provision 36.87 36.26 36.25 36.26 36.83 35.63 35.77 36.00
Net Earnings 3.64% 3.87% 4.83% 3.26% 3.02% 3.48% 4.50% 2.93%
Fiscal 1998
Fiscal 1998
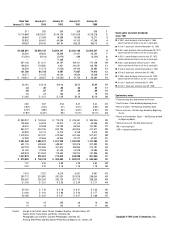
(Unaudited)
34