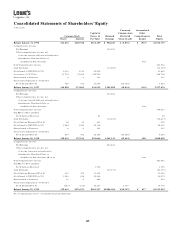
Lowe's 1998 Annual Report Download - page 33
Download and view the complete annual report
Please find page 33 of the 1998 Lowe's annual report below. You can navigate through the pages in the report by either clicking on the pages listed below, or by using the keyword search tool below to find specific information within the annual report.-
 1
1 -
2
-
3
-
4
-
5
-
6
-
7
-
8
-
9
-
10
-
11
-
12
-
13
-
14
-
15
-
16
-
17
-
18
-
19
-
20
-
21
-
22
-
 23
23 -
 24
24 -
 25
25 -
 26
26 -
 27
27 -
 28
28 -
 29
29 -
 30
30 -
 31
31 -
 32
32 -
 33
33 -
 34
34 -
 35
35 -
 36
36 -
 37
37 -
 38
38 -
 39
39 -
 40
40
 |
 |

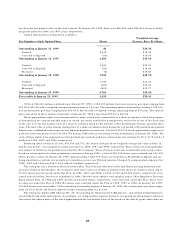
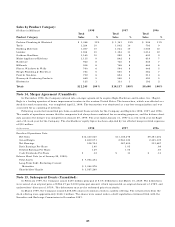
Sales by Product Category:
(Dollars in Millions) 1998 1997 1996
Total Total Total
Product Category Sales % Sales % Sales %
Fashion Plumbing & Electrical $ 1,388 11% $ 1,161 12% $ 908 11%
Tools 1,234 10 1,002 10 793 9
Building Materials 1,207 10 1,034 10 1,008 12
Lumber 1,186 10 1,124 11 1,014 12
Outdoor Hardlines 1,165 10 929 9 803 9
Major Appliances/Kitchens 1,115 9 842 8 619 7
Hardware 922 8 745 8 636 7
Millwork 908 8 748 8 664 8
Floors, Windows & Walls 790 6 594 6 448 5
Rough Plumbing & Electrical 784 6 655 6 584 7
Paint & Sundries 752 6 624 6 511 6
Nursery & Gardening Products 669 5 546 5 420 5
Electronics 125 1 133 1 192 2
Totals $12,245 100% $10,137 100% $8,600 100%
Note 14, Merger Agreement (Unaudited):
In November 1998, the Company entered into a merger agreement to acquire Eagle Hardware and Garden, Inc. (Eagle).
Eagle is a leading operator of home improvement centers in the western United States. The transaction, which was effected as a
stock-for-stock transaction, was completed April 2, 1999. The transaction was structured as a tax-free reorganization and was
accounted for as a pooling of interests.
Following is selected unaudited pro forma combined financial data for the Company and Eagle for 1998, 1997 and 1996.
The results of operations assume that the companies had always been combined for accounting purposes, and the balance sheet
data assumes the merger was completed on January 29, 1999. The year ended January 31, 1997 was a 53-week year for Eagle
and a 52-week year for the Company. The stockholders’ equity figure has been adjusted by tax effected merger related expenses
of $10 million.
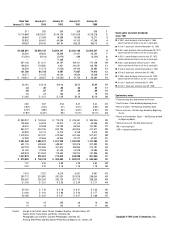
(In Thousands) 1998 1997 1996
Results of Operations Data:
Net Sales $13,330,540 $11,108,378 $9,361,204
Gross Margin 3,602,071 2,963,125 2,435,339
Net Earnings 518,754 387,400 313,887
Basic Earnings Per Share 1.40 1.05 .89
Diluted Earnings Per Share 1.39 1.05 .87
Cash Dividends Per Share $ .12 $ .11 $ .10
Balance Sheet Data (as of January 29, 1999):
Total Assets $ 7,064,404
Long-Term Debt, Excluding Current
Maturities $ 1,364,278
Shareholders’ Equity $ 3,587,289
Note 15, Subsequent Events (Unaudited):
In February 1999, the Company issued $400 million principal of 6.5% Debentures due March 15, 2029. The debentures
were issued at an original price of $986.47 per $1000 principal amount, which represented an original discount of .478% and
underwriters’ discount of .875%. The debentures may not be redeemed prior to maturity.
In March 1999, the Company issued 6,206,895 shares of common stock in a public offering. The net proceeds from the
stock offering were approximately $348.1 million. The shares were issued under a shelf registration statement filed with the
Securities and Exchange Commission in December 1997.
31