Lowe's 1998 Annual Report Download - page 38
Download and view the complete annual report
Please find page 38 of the 1998 Lowe's annual report below. You can navigate through the pages in the report by either clicking on the pages listed below, or by using the keyword search tool below to find specific information within the annual report.-
 1
1 -
2
-
3
-
4
-
5
-
6
-
7
-
8
-
9
-
10
-
11
-
12
-
13
-
14
-
15
-
16
-
17
-
18
-
19
-
20
-
21
-
22
-
23
-
24
-
25
-
26
-
27
-
 28
28 -
 29
29 -
 30
30 -
 31
31 -
 32
32 -
 33
33 -
 34
34 -
 35
35 -
 36
36 -
 37
37 -
 38
38 -
 39
39 -
 40
40
 |
 |

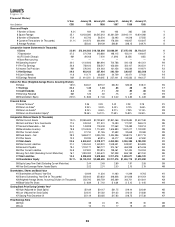
Financial History 5-Year January 29, January 30, January 31, January 31, January 31,
Years Ended on CGR 1999 1998 1997 1996 1995
Stores and People
1 Number of Stores 9.2% 484 446 402 365 336
2 Square Footage 25.1 43,403,380 36,545,343 30,381,529 23,945,111 18,604,368
3 Number of Employees 17.9 65,706 58,504 53,492 44,546 37,555
4 Customer Transactions (In Thousands) 21.1% 241,972 206,498 176,206 146,957 122,847
5 Average Purchase $50.60 $49.09 $48.81 $48.15 $49.74
Comparative Income Statements (In Thousands)
6 Sales 22.0% $12,244,882 $10,136,890 $8,600,241 $7,075,442 $6,110,521
7 Depreciation 27.5 271,769 240,880 198,115 150,011 109,647
8 LIFO Credit (Charge) NM 29,008 7,000 (1,390) (8,250) (435)
9 Store Restructuring — — — — — —
10 Operating Income130.0 1,104,926 864,994 700,788 540,158 481,051
11 Pre-Tax Earnings 30.8 758,422 558,547 453,606 352,107 343,531
12 Income Tax Provision NM 276,000 201,063 161,456 126,080 119,971
13 Net Earnings 29.6 482,422 357,484 292,150 226,027 223,560
14 Cash Dividends 11.8 41,171 38,239 34,709 30,471 27,433
15 Earnings Retained NM $ 441,251 $ 319,245 $ 257,441 $ 195,556 $ 196,127
Dollars Per Share (Weighted Average, Assuming Dilution)
16 Sales 18.5% $34.61 $29.07 $24.90 $20.65 $18.41
17 Earnings 25.3 1.36 1.03 .86 .68 .70
18 Cash Dividends 8.4 .12 .11 .10 .09 .08
19 Earnings Retained NM 1.25 .92 .75 .57 .59
20 Shareholders’ Equity 25.5% $ 8.86 $ 7.46 $ 6.42 $ 4.83 $ 4.28
Financial Ratios
21 Asset Turnover22.35 2.29 2.42 2.28 2.78
22 Return on Sales33.94% 3.53% 3.40% 3.19% 3.66%
23 Return on Assets49.24% 8.06% 8.21% 7.28% 10.15%
24 Return on Shareholders’ Equity518.55% 16.12% 17.63% 15.92% 25.59%
Comparative Balance Sheets (In Thousands)
25 Total Current Assets 19.0% $2,585,683 $2,109,602 $1,851,466 $1,603,684 $1,557,168
26 Cash and Short-Term Investments 17.5 243,052 211,301 70,490 171,297 268,474
27 Accounts Receivable — Net 24.3 143,928 118,408 117,562 113,483 109,214
28 Merchandise Inventory 19.8 2,104,845 1,714,592 1,605,880 1,267,077 1,132,282
29 Other Current Assets (9.1) 37,734 31,185 37,682 32,659 29,069
30 Fixed Assets – Net 28.9 3,636,917 3,005,199 2,494,396 1,858,274 1,397,713
31 Other Assets 10.3 93,335 69,315 53,477 53,369 67,652
32 Total Assets 23.6 6,344,651 5,219,277 4,434,954 3,556,386 3,105,992
33 Total Current Liabilities 21.0 1,765,344 1,449,320 1,348,531 949,931 945,893
34 Accounts Payable 19.4 1,133,177 969,777 914,167 655,399 675,436
35 Other Current Liabilities 24.8 247,820 220,915 198,461 151,494 134,334
36 Long-Term Debt (Excluding Current Maturities) 16.7 1,283,092 1,045,570 767,338 866,183 681,184
37 Total Liabilities 19.3 3,208,699 2,618,668 2,217,478 1,899,671 1,686,102
38 Shareholders’ Equity 29.1% $3,135,952 $2,600,609 $2,217,476 $1,656,715 $1,419,890
39 Equity/Long-Term Debt
(Excluding Current Maturities)
2.44 2.49 2.89 1.91 2.08
40 Year-End Leverage Factor: Assets/Equity 2.02 2.01 2.00 2.15 2.19
Shareholders, Shares and Book Value
41 Shareholders of Record, Year-End 13,499 11,334 11,460 11,299 9,765
42 Shares Outstanding, Year-End (In Thousands) 352,643 350,632 346,808 321,836 319,054
43 Weighted Average Shares, Assuming Dilution (In Thousands) 353,795 348,759 345,369 342,701 331,841
44 Book Value Per Share $ 8.89 $ 7.42 $ 6.39 $ 5.15 $ 4.45
Closing Stock Price During Calendar Year6
45 High (Adjusted for Stock Splits) $51.69 $24.56 $21.75 $19.44 $20.69
46 Low (Adjusted for Stock Splits) $22.00 $15.82 $14.32 $13.00 $13.88
47 Closing Price December 31 $51.19 $23.85 $17.82 $16.75 $17.38
Price/Earnings Ratio
48 High 38 24 25 29 30
49 Low 16 15 17 19 20
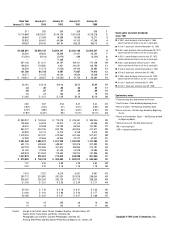
Financial History 5-Year January 29, January 30, January 31, January 31, January 31,
Years Ended on CGR 1999 1998 1997 1996 1995
Stores and People
1 Number of Stores 9.2% 484 446 402 365 336 1
2 Square Footage 25.1 43,403,380 36,545,343 30,381,529 23,945,111 18,604,368 2
3 Number of Employees 17.9 65,706 58,504 53,492 44,546 37,555 3
4 Customer Transactions (In Thousands) 21.1% 241,972 206,498 176,206 146,957 122,847 4
5 Average Purchase $50.60 $49.09 $48.81 $48.15 $49.74 5
Comparative Income Statements (In Thousands)
6 Sales 22.0% $12,244,882 $10,136,890 $8,600,241 $7,075,442 $6,110,521 6
7 Depreciation 27.5 271,769 240,880 198,115 150,011 109,647 7
8 LIFO Credit (Charge) NM 29,008 7,000 (1,390) (8,250) (435) 8
9 Store Restructuring — — — — — — 9
10 Operating Income130.0 1,104,926 864,994 700,788 540,158 481,051 10
11 Pre-Tax Earnings 30.8 758,422 558,547 453,606 352,107 343,531 11
12 Income Tax Provision NM 276,000 201,063 161,456 126,080 119,971 12
13 Net Earnings 29.6 482,422 357,484 292,150 226,027 223,560 13
14 Cash Dividends 11.8 41,171 38,239 34,709 30,471 27,433 14
15 Earnings Retained NM $ 441,251 $ 319,245 $ 257,441 $ 195,556 $ 196,127 15
Dollars Per Share (Weighted Average Shares, Assuming Dilution)
16 Sales 18.5% $34.61 $29.07 $24.90 $20.65 $18.41 16
17 Earnings 25.3 1.36 1.03 .86 .68 .70 17
18 Cash Dividends 8.4 .12 .11 .10 .09 .08 18
19 Earnings Retained NM 1.25 .92 .75 .57 .59 19
20 Shareholders’ Equity 25.5% $ 8.86 $ 7.46 $ 6.42 $ 4.83 $ 4.28 20
Financial Ratios
21 Asset Turnover22.35 2.29 2.42 2.28 2.78 21
22 Return on Sales33.94% 3.53% 3.40% 3.19% 3.66% 22
23 Return on Assets49.24% 8.06% 8.21% 7.28% 10.15% 23
24 Return on Shareholders’ Equity518.55% 16.12% 17.63% 15.92% 25.59% 24
Comparative Balance Sheets (In Thousands)
25 Total Current Assets 19.0% $2,585,683 $2,109,602 $1,851,466 $1,603,684 $1,557,168 25
26 Cash and Short-Term Investments 17.5 243,052 211,301 70,490 171,297 268,474 26
27 Accounts Receivable — Net 24.3 143,928 118,408 117,562 113,483 109,214 27
28 Merchandise Inventory 19.8 2,104,845 1,714,592 1,605,880 1,267,077 1,132,282 28
29 Other Current Assets (9.1) 37,734 31,185 37,682 32,659 29,069 29
30 Fixed Assets – Net 28.9 3,636,917 3,005,199 2,494,396 1,858,274 1,397,713 30
31 Other Assets 10.3 93,335 69,315 53,477 53,369 67,652 31
32 Total Assets 23.6 6,344,651 5,219,277 4,434,954 3,556,386 3,105,992 32
33 Total Current Liabilities 21.0 1,765,344 1,449,320 1,348,531 949,931 945,893 33
34 Accounts Payable 19.4 1,133,177 969,777 914,167 655,399 675,436 34
35 Other Current Liabilities 24.8 247,820 220,915 198,461 151,494 134,334 35
36 Long-Term Debt (Excluding Current Maturities) 16.7 1,283,092 1,045,570 767,338 866,183 681,184 36
37 Total Liabilities 19.3 3,208,699 2,618,668 2,217,478 1,899,671 1,686,102 37
38 Shareholders’ Equity 29.1% $3,135,952 $2,600,609 $2,217,476 $1,656,715 $1,419,890 38
39 Equity/Long-Term Debt
(Excluding Current Maturities)
2.44 2.49 2.89 1.91 2.08 39
40 Year-End Leverage Factor: Assets/Equity 2.02 2.01 2.00 2.15 2.19 40
Shareholders, Shares and Book Value
41 Shareholders of Record, Year-End 13,499 11,334 11,460 11,299 9,765 41
42 Shares Outstanding, Year-End (In Thousands) 352,643 350,632 346,808 321,836 319,054 42
43 Weighted Average Shares, Assuming Dilution (In Thousands) 353,795 348,759 345,369 342,701 331,841 43
44 Book Value Per Share $ 8.89 $ 7.42 $ 6.39 $ 5.15 $ 4.45 44
Closing Stock Price During Calendar Year6
45 High (Adjusted for Stock Splits) $51.69 $24.47 $21.75 $19.44 $20.69 45
46 Low (Adjusted for Stock Splits) $22.00 $15.82 $14.32 $13.00 $13.88 46
47 Closing Price December 31 $51.19 $23.85 $17.82 $16.75 $17.38 47
Price/Earnings Ratio
48 High 38 24 25 29 30 48
49 Low 16 15 17 19 20 49
36