Lowe's 1998 Annual Report Download - page 20
Download and view the complete annual report
Please find page 20 of the 1998 Lowe's annual report below. You can navigate through the pages in the report by either clicking on the pages listed below, or by using the keyword search tool below to find specific information within the annual report.-
 1
1 -
2
-
3
-
4
-
5
-
6
-
7
-
8
-
9
-
 10
10 -
 11
11 -
 12
12 -
 13
13 -
 14
14 -
 15
15 -
 16
16 -
 17
17 -
 18
18 -
 19
19 -
 20
20 -
 21
21 -
 22
22 -
 23
23 -
 24
24 -
 25
25 -
 26
26 -
 27
27 -
 28
28 -
 29
29 -
 30
30 -
31
-
32
-
33
-
34
-
35
-
36
-
37
-
38
-
39
-
40
 |
 |
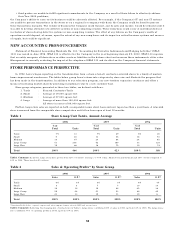
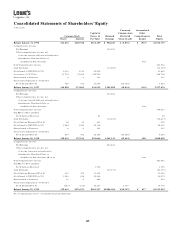
STORE PERFORMANCE PERSPECTIVE
In 1992, Lowe’s began reporting on the transformation from a chain of small, contractor-oriented stores to a family of modern
home-improvement warehouses. The tables below group Lowe’s stores into categories by store size and illustrate the progress that
has been made in the transformation. In addition to our relocation program, our new territory expansion continues and offers a
means of increasing market share by providing exceptional value to a new customer base.
Store group categories, presented in these two tables, are defined as follows:
1. Yards : Focused Contractor Yards
2. Small : Average of 19,000 square feet
3. Medium : Average of 57,000 square feet
4. Large : Average of more than 100,000 square feet.
All stores in excess of 80,000 square feet.
Further, Large store sales are reported on both a comparable (same store) basis and new (open less than a year) basis. A relocated
store is removed from the comparable store computation until it has been open at least 12 months.
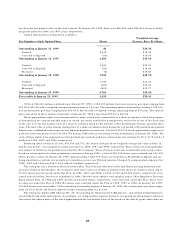
Table 1 Store Group Unit Totals, Annual Average
Table 1 Comments: As shown, Large stores have grown from 52% of total two years ago, to 70% today. Small stores and Yards are just 16% of total compared to
24% in 1996. These trends will continue.
Table 2 Sales & Operating Profits* by Store Group
*Operating Profits before corporate expense and intercompany charges, interest, LIFO and income taxes.
Table 2 Comments: Reflecting the changing mix of units shown in Table 1, Large stores contributed 80% of sales in 1998, up from 61% in 1996. The Large stores
also contributed 77% of operating profits in 1998, up from 53% in 1996.
1998 1997 1996
% of % of % of
Total Units Total Units Total Units
Yards 7% 31 7% 29 6% 25
Small 9 40 13 55 18 70
Medium 14 67 20 84 24 95
Large Comp 51 238 42 180 33 124
Large New 19 88 18 75 19 74
Total 100% 464 100% 423 100% 388
1998 1997 1996
Sales O.P.* Sales O.P.* Sales O.P.*
Yards 4% 3% 4% 3% 4% 3%
Small 4 4 7 7 10 10
Medium 12 16 19 26 25 34
Large Comp 59 64 51 53 42 45
Large New 21 13 19 11 19 8
Total 100% 100% 100% 100% 100% 100%
• third parties are unable to fulfill significant commitments to the Company as a result of their failure to effectively address
their Year 2000 problems,
the Company’s ability to carry out its business could be adversely affected. For example, if the Company’s IT and non-IT systems
are unable to process transactions in the stores or on a regional or company-wide basis, the Company could be forced to process
these transactions manually. The volume of business the Company could transact, and its sales and income, would be reduced until it
was able to develop alternatives to defective systems or non-complying vendors. These reductions could occur at individual stores or
in clusters of stores sharing defective systems or non-complying vendors. The effect of any failures on the Company’s results of
operations would depend, of course, upon the extent of any non-compliance and its impact on critical business systems and sourc es
of supply, but could be significant.
NEW ACCOUNTING PRONOUNCEMENTS
Statement of Financial Accounting Standards No. 133, “Accounting for Derivative Instruments and Hedging Activities” (SFAS
133) was issued in June 1998. SFAS 133 is effective for the Company in the year beginning January 29, 2000. SFAS 133 requires
that an entity recognize all derivatives as either assets or liabilities in the balance sheet and measure those instruments at fair value.
Management is currently evaluating the impact of the adoption of SFAS 133 and its effect on the Company’s financial statements.
18