Lowe's 1998 Annual Report Download - page 22
Download and view the complete annual report
Please find page 22 of the 1998 Lowe's annual report below. You can navigate through the pages in the report by either clicking on the pages listed below, or by using the keyword search tool below to find specific information within the annual report.-
 1
1 -
2
-
3
-
4
-
5
-
6
-
7
-
8
-
9
-
10
-
11
-
 12
12 -
 13
13 -
 14
14 -
 15
15 -
 16
16 -
 17
17 -
 18
18 -
 19
19 -
 20
20 -
 21
21 -
 22
22 -
 23
23 -
 24
24 -
 25
25 -
 26
26 -
 27
27 -
 28
28 -
 29
29 -
 30
30 -
 31
31 -
 32
32 -
33
-
34
-
35
-
36
-
37
-
38
-
39
-
40
 |
 |
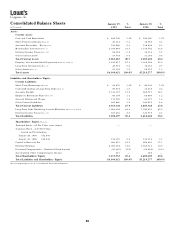
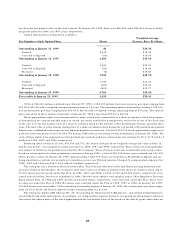
Consolidated Balance Sheets
In Thousands
January 29, % January 30, %
1999 Total 1998 Total
Assets
Current Assets:
Cash and Cash Equivalents $ 222,709 3.5% $ 195,146 3.7%
Short-Term Investments (Note 2) 20,343 0.3 16,155 0.3
Accounts Receivable – Net (Note 4) 143,928 2.3 118,408 2.3
Merchandise Inventory (Note 1) 2,104,845 33.2 1,714,592 32.8
Deferred Income Taxes (Note 11) 56,124 0.9 34,116 0.7
Other Current Assets 37,734 0.5 31,185 0.6
Total Current Assets 2,585,683 40.7 2,109,602 40.4
Property, Less Accumulated Depreciation (Notes 3 and 5) 3,636,917 57.3 3,005,199 57.6
Long-Term Investments (Note 2) 28,716 0.5 35,161 0.7
Other Assets (Note 1) 93,335 1.5 69,315 1.3
Total Assets $6,344,651 100.0% $5,219,277 100.0%
Liabilities and Shareholders’ Equity
Current Liabilities:
Short-Term Borrowings (Note 4) $ 92,475 1.4% $ 98,104 1.9%
Current Maturities of Long-Term Debt (Note 5) 99,019 1.6 12,478 0.2
Accounts Payable 1,133,177 17.9 969,777 18.7
Employee Retirement Plans (Note 10) 80,104 1.3 64,669 1.2
Accrued Salaries and Wages 112,749 1.8 83,377 1.6
Other Current Liabilities 247,820 3.9 220,915 4.2
Total Current Liabilities 1,765,344 27.9 1,449,320 27.8
Long-Term Debt, Excluding Current Maturities (Notes 5, 6 and 9) 1,283,092 20.2 1,045,570 20.0
Deferred Income Taxes (Note 11) 160,263 2.5 123,778 2.4
Total Liabilities 3,208,699 50.6 2,618,668 50.2
Shareholders’ Equity (Note 8):
Preferred Stock – $5 Par Value, none issued — —
Common Stock – $.50 Par Value;
Issued and Outstanding
January 29, 1999 352,643
January 30, 1998 350,632 176,321 2.8 175,316 3.3
Capital in Excess of Par 983,217 15.5 892,666 17.1
Retained Earnings 2,006,384 31.6 1,565,133 30.0
Unearned Compensation – Restricted Stock Awards (30,387) (0.5) (32,694) (0.6)
Accumulated Other Comprehensive Income 417 — 188 —
Total Shareholders’ Equity 3,135,952 49.4 2,600,609 49.8
Total Liabilities and Shareholders’ Equity $6,344,651 100.0% $5,219,277 100.0%
See accompanying notes to consolidated financial statements.
20