Lowe's 1999 Annual Report Download - page 17
Download and view the complete annual report
Please find page 17 of the 1999 Lowe's annual report below. You can navigate through the pages in the report by either clicking on the pages listed below, or by using the keyword search tool below to find specific information within the annual report.-
 1
1 -
2
-
3
-
4
-
5
-
6
-
 7
7 -
 8
8 -
 9
9 -
 10
10 -
 11
11 -
 12
12 -
 13
13 -
 14
14 -
 15
15 -
 16
16 -
 17
17 -
 18
18 -
 19
19 -
 20
20 -
 21
21 -
 22
22 -
 23
23 -
 24
24 -
 25
25 -
 26
26 -
 27
27 -
28
-
29
-
30
-
31
-
32
-
33
-
34
-
35
-
36
-
37
-
38
-
39
-
40
 |
 |

15
Management’s Discussion and
Analysis of Financial Condition
and Results of Operations
This discussion summarizes the significant factors
affecting the Company’s consolidated operating results and
liquidity and capital resources during the three-year
period ended January 28, 2000 (i.e., fiscal years 1999,
1998 and 1997). This discussion should be read in con-
junction with the Letter to Shareholders, financial state-
ments, and financial statement footnotes included in this
annual report.
The Company changed its method of accounting for
substantially all of its inventories from the Last-In-First-
Out (LIFO) method to the First-In-First-Out (FIFO)
method effective for the fiscal year ended January 28, 2000.
The Company has been experiencing reduced costs in most
product categories resulting from a combination of better
buying, increased imports and logistics efficiencies. There-
fore, management believes the FIFO method provides a
better measurement of operating results. The change will
also aid in financial statement comparability within the
retail home improvement industry segment.
Prior period consolidated financial statements have
been restated for the retroactive effect of the change in
accounting method. A LIFO adjustment was not required
during 1999 because the calculated effect was minimal;
therefore there was no effect on current year earnings. The
effect of this change on the Company’s net earnings and
retained earnings for the years ended January 29, 1999
and January 30, 1998 was a decrease of $18.4 million ($.05
per share diluted) and $4.4 million ($.01 per share
diluted), respectively.
The Company completed its merger with Eagle Hard-
ware & Garden, Inc. (Eagle) on April 2, 1999. The trans-
action, which was valued at approximately $1.3 billion,
was structured as a tax-free exchange of the Company’s
common stock for Eagle’s common stock, and was
accounted for as a pooling of interests. As a result,
all current and historical financial information is presented
on a combined basis.
OPERATIONS
Net earnings for 1999 increased 34% to $672.8 mil-
lion or 4.2% of sales compared to $500.4 million or 3.8%
of sales for 1998. Diluted earnings per share were $1.75
for 1999 compared to $1.34 for 1998 and $1.04 for 1997.
Return on beginning assets was 9.5% for 1999 compared
to 8.5% for 1998; and return on beginning shareholders’
equity was 18.6% for 1999 compared to 16.8% for 1998.
Net earnings for 1999, excluding the one-time charge
of $.04 per share for costs relating to the merger with Eagle,
increased 38% to $689.8 million or 4.3% of sales. Diluted
earnings per share, excluding the one-time charge, were
$1.79 for 1999. Excluding the one-time charge, return on
beginning assets was 9.7% for 1999; and return on begin-
ning shareholders’ equity was 19.1% for 1999.
The Company’s sales were $15.9 billion in 1999, a
19% increase over 1998 sales of $13.3 billion. Sales for
1998 were 20% higher than 1997 levels. Comparable store
sales increased 6.2% in 1999. The increases in sales are
attributable to the Company’s ongoing store expansion and
relocation program along with the growth in comparable
store sales. Comparable store sales increases are driven by
the Company’s focus on commercial business, special
order, and installed sales initiatives, which is combined
with the continued strategy of employing an expanded
inventory assortment, everyday competitive prices and an
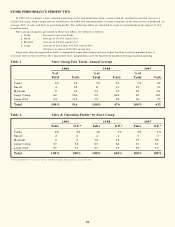
emphasis on customer service. The following table pre-
sents sales and store information:
1999 1998 1997
Sales (in millions) $15,906 $13,331 $11,108
Sales Increases 19% 20% 19%
Comparable Store Sales Increases 6% 6% 4%
At end of year:
Stores 576 520 477
Sales Floor Square Feet (in millions) 57.0 47.8 39.9
Average Store Size Net Selling
Square Feet (in thousands) 99 92 84
Gross margin in 1999 was 27.5% of sales compared to
26.8% in 1998. Both of these years showed improvement
over the 26.6% rate achieved in 1997. Lower product
acquisition costs, along with adherence to careful pricing
disciplines in the execution of the Company’s everyday
competitive pricing strategy, and changes in product mix
resulting from the expanded merchandise selection avail-
able in larger stores continued to provide margin improve-
ments during 1999 and 1998. In addition, an increase in
the level of controls relating to inventory shrinkage also
contributed to gross margin improvements in 1999.
Selling, general and administrative expenses (SG&A)
were $2.8 billion or 17.4% of sales in 1999. SG&A in the
two previous years were $2.3 and $2.0 billion or 17.5%
and 17.6% of sales, respectively. The 10 basis point
decrease in 1999 and 1998 resulted primarily from lower
net advertising costs, increased credit card program
income and leveraging of expenses.