Lowe's 1999 Annual Report Download - page 18
Download and view the complete annual report
Please find page 18 of the 1999 Lowe's annual report below. You can navigate through the pages in the report by either clicking on the pages listed below, or by using the keyword search tool below to find specific information within the annual report.-
 1
1 -
2
-
3
-
4
-
5
-
6
-
7
-
 8
8 -
 9
9 -
 10
10 -
 11
11 -
 12
12 -
 13
13 -
 14
14 -
 15
15 -
 16
16 -
 17
17 -
 18
18 -
 19
19 -
 20
20 -
 21
21 -
 22
22 -
 23
23 -
 24
24 -
 25
25 -
 26
26 -
 27
27 -
 28
28 -
29
-
30
-
31
-
32
-
33
-
34
-
35
-
36
-
37
-
38
-
39
-
40
 |
 |

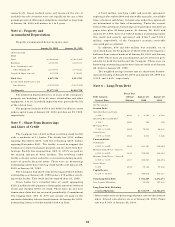
16
Store opening costs were $98.4 million for 1999 com-
pared to $75.6 and $72.7 million in 1998 and 1997,
respectively, and were expensed as incurred. These costs
are associated with the opening of 91 stores in 1999 (60
new and 31 relocated). This compares to 81 stores in 1998
(50 new and 31 relocated) and 72 stores in 1997 (48 new
and 24 relocated). As a percentage of sales, store opening
costs were 0.6% for both 1999 and 1998 and 0.7% for
1997. Store opening costs averaged approximately $1.0
million per store in 1999.
Depreciation, reflecting continued fixed asset expan-
sion, increased 17% to $337.4 million in 1999, compared
to increases of 13% and 22% in 1998 and 1997, respec-
tively. Depreciation as a percentage of sales was 2.1% for
1999, a slight decrease from 2.2% in 1998 and 2.3% in
1997. Approximately 29% of new stores opened in the
last three years have been leased, of which approximately
47%, 43% and 25% in 1999, 1998 and 1997, respectively,
were under capital leases. Property, less accumulated
depreciation, increased to $5.2 billion at January 28, 2000
compared to $4.1 billion at January 29, 1999. The
increase in property resulted primarily from the Company’s
store expansion program, including land, building, store
equipment, fixtures and displays.
Net interest costs as a percent of sales were 0.5% for
1999 and 0.6% for 1998 and 1997. Net interest costs
totaled $84.9 million in 1999, $80.9 million in 1998 and
$71.6 million in 1997. Interest costs relating to capital
leases were $42.6, $39.3 and $38.4 million for 1999, 1998
and 1997, respectively. See the discussion of liquidity and
capital resources below.
The Company’s effective income tax rates were 36.7%,
36.4% and 36.0% in 1999, 1998 and 1997, respectively.
The higher rates in 1999 and 1998 were primarily related
to expansion into states with higher state income tax rates.
The rate increase in 1999 is also attributable to the impact
of non-deductible merger expenses.
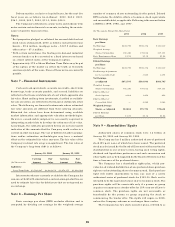
LIQUIDITY AND CAPITAL RESOURCES
Primary sources of liquidity are cash flows from oper-
ating activities and certain financing activities. Net cash
provided by operating activities was $1.2 billion for 1999.
This compares to $741.6 and $691.0 million in 1998 and
1997, respectively. The increase in net cash provided by
operating activities for 1999 and 1998 is primarily related
to increased earnings and various operating liabilities
which were offset by an increase in inventory, net of an
increase in accounts payable from year to year. Working
capital at January 28, 2000 was $1.3 billion compared to
$942.6 million at January 29, 1999.
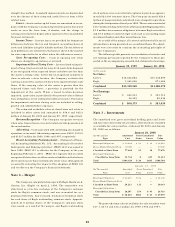
The primary component of net cash used in investing
activities continues to be new store facilities in con-
nection with the Company’s expansion plan. Cash acquisi-
tions of fixed assets were $1.5 billion for 1999. This compares
to $1.1 billion and $826.2 million for 1998 and 1997,
respectively. Retail selling space as of January 28, 2000
increased 19% over the selling space as of January 29,
1999. The January 29, 1999 selling space total of 47.8
million square feet represents a 20% increase over 1997.
Financing and investing activities also include noncash
transactions of capital leases for new store facilities and
equipment, the result of which is to increase long-term
debt and property. During 1999, 1998 and 1997, the
Company acquired fixed assets (primarily new store
facilities) under capital leases of $27.6, $47.3 and $32.7
million, respectively.
Cash flows provided by financing activities were
$593.4, $287.5 and $265.1 million in 1999, 1998 and
1997, respectively. The major cash components of financ-
ing activities in 1999 included increased cash from the
issuance of $400 million principal amount of 6.5%
debentures due March 15, 2029 in a private offering, and
$348.3 million in net proceeds from a common stock
offering, offset by a decrease in cash from the payment of
$47.6 million in cash dividends and $108.3 million in
scheduled debt maturities. In 1998, financing activities
included the issuance of $300 million principal amount
of 6.875% debentures, $50.8 million in cash dividend
payments and $23.3 million in scheduled debt repayments.
Major financing activities during 1997 included cash
received from the issuance of $268 million aggregate prin-
cipal of Medium Term Notes, offset by cash dividend pay-
ments of $28.7 million and $36.3 million of scheduled
debt repayments. The ratio of long-term debt to equity
plus long-term debt was 27.6%, 28.9% and 28.9% as of
year end 1999, 1998 and 1997, respectively. The decrease
in 1999 was primarily due to proceeds from a common
stock offering as previously described.
At January 28, 2000, the Company had a $300 mil-
lion revolving credit facility with a syndicate of eleven
banks, available lines of credit aggregating $218 million
for the purpose of issuing documentary letters of credit
and standby letters of credit and $50 million available, on
an unsecured basis, for the purpose of short-term borrow-
ings. At January 28, 2000, outstanding letters of credit
aggregated $108.8 million. The revolving credit facility
has $100 million expiring in November 2000, with the
remaining $200 million expiring in November 2001. In
addition, the Company has a $100 million revolving credit
and security agreement from a financial institution with
$92.5 million outstanding at January 28, 2000.