Lowe's 1999 Annual Report Download - page 36
Download and view the complete annual report
Please find page 36 of the 1999 Lowe's annual report below. You can navigate through the pages in the report by either clicking on the pages listed below, or by using the keyword search tool below to find specific information within the annual report.-
 1
1 -
2
-
3
-
4
-
5
-
6
-
7
-
8
-
9
-
10
-
11
-
12
-
13
-
14
-
15
-
16
-
17
-
18
-
19
-
20
-
21
-
22
-
23
-
24
-
25
-
 26
26 -
 27
27 -
 28
28 -
 29
29 -
 30
30 -
 31
31 -
 32
32 -
 33
33 -
 34
34 -
 35
35 -
 36
36 -
 37
37 -
 38
38 -
 39
39 -
 40
40
 |
 |
34
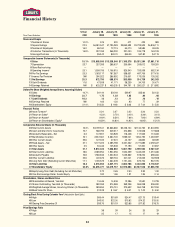
Financial History
5-Year January 28, January 29, January 30, January 31, January 31,
Fiscal Years Ended on CGR 2000 1999 1998 1997 1996
Stores and People
1 Number of Stores 10.2% 576 520 477 429 389
2 Square Footage 22.3 56,981,547 47,795,283 39,860,593 33,729,529 26,806,111
3 Number of Employees 16.2 86,160 72,715 64,070 58,585 48,405
4 Customer Transactions (In Thousands) 16.9% 297,769 268,232 231,000 195,778 163,193
5 Average Purchase $53.42 $49.70 $48.09 $47.82 $47.13
Comparative Income Statements (In Thousands)
6 Sales 19.1% $15,905,595 $13,330,540 $11,108,378 $9,361,204 $7,691,116
7 Depreciation 23.7 337,359 288,607 255,694 209,612 159,281
8 Store Restructuring — —————
9 Operating Income125.1 1,509,706 1,156,915 925,940 753,099 582,134
10 Pre-Tax Earnings 25.3 1,063,117 787,367 598,631 487,765 377,415
11 Income Tax Provision NM 390,322 286,992 215,601 173,035 135,052
12 Net Earnings 25.3 672,795 500,374 383,030 314,730 242,363
13 Cash Dividends 11.6 47,558 41,171 38,239 34,709 30,471
14 Earnings Retained NM $ 625,237 $ 459,203 $ 344,791 $ 280,021 $ 211,892
Dollars Per Share (Weighted Average Shares, Assuming Dilution)
15 Sales 16.7% $41.44 $35.48 $29.97 $25.66 $21.52
16 Earnings 22.7 1.75 1.33 1.03 .86 .68
17 Cash Dividends 10.2 .13 .12 .11 .10 .10
18 Earnings Retained NM 1.63 1.22 .93 .77 .59
19 Shareholders’ Equity 21.4% $12.23 $ 9.63 $ 8.03 $ 7.04 $ 5.20
Financial Ratios
20 Asset Turnover22.24 2.27 2.22 2.36 2.22
21 Return on Sales34.23% 3.75% 3.45% 3.36% 3.15%
22 Return on Assets49.49% 8.54% 7.66% 7.93% 6.99%
23 Return on Shareholders’ Equity518.59% 16.80% 14.92% 16.95% 15.12%
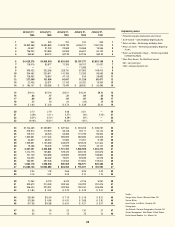
Comparative Balance Sheets (In Thousands)
24 Total Current Assets 16.3% $3,709,541 $2,866,860 $2,428,104 $2,134,762 $1,804,994
25 Cash and Short-Term Investments 15.7 568,792 249,217 274,858 122,558 177,888
26 Accounts Receivable – Net 6.3 147,901 143,928 118,408 117,562 113,483
27 Merchandise Inventory 16.1 2,812,361 2,384,700 1,985,041 1,854,795 1,483,397
28 Other Current Assets 29.6 127,342 47,201 40,127 46,825 38,329
29 Fixed Assets – Net 27.1 5,177,222 4,085,798 3,321,332 2,771,889 2,059,427
30 Other Assets 3.5 94,446 105,508 77,193 57,300 61,857
31 Total Assets 21.1 9,012,323 7,086,882 5,861,790 4,999,566 3,967,337
32 Total Current Liabilities 18.6 2,385,954 1,924,256 1,554,359 1,443,249 1,051,466
33 Accounts Payable 16.8 1,566,946 1,220,543 1,035,882 978,224 696,484
34 Other Current Liabilities 22.6 400,676 269,734 241,041 213,062 162,598
35 Long-Term Debt (Excluding Current Maturities) 17.1 1,726,579 1,364,278 1,191,406 875,754 967,725
36 Total Liabilities 18.3 4,316,852 3,467,115 2,883,786 2,432,020 2,110,637
37 Shareholders’ Equity 24.0% $4,695,471 $3,619,767 $2,978,004 $2,567,546 $1,856,700
38 Equity/Long-Term Debt
(Excluding Current Maturities)
2.72 2.65 2.50 2.93 1.92
39 Year-End Leverage Factor: Assets/Equity 1.92 1.96 1.97 1.95 2.14
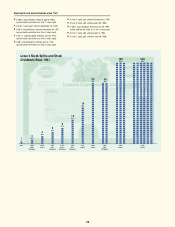
Shareholders, Shares and Book Value
40 Shareholders of Record, Year-End 15,446 14,508 12,386 12,530 12,728
41 Shares Outstanding, Year-End (In Thousands) 382,359 374,388 369,238 365,298 336,492
42 Weighted Average Shares, Assuming Dilution (In Thousands) 383,854 375,751 370,632 364,758 357,334
43 Book Value Per Share $12.28 $ 9.67 $ 8.07 $ 7.03 $ 5.52
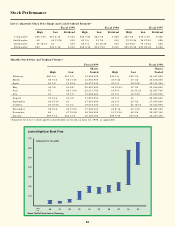
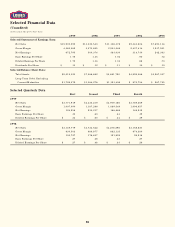
Closing Stock Price During Calendar Year6 (Adjusted for Stock Splits)
44 High $66.44 $51.69 $24.47 $21.75 $19.44
45 Low $43.00 $22.00 $15.82 $14.32 $13.00
46 Closing Price December 31 $59.75 $51.19 $23.85 $17.82 $16.75
Price/Earnings Ratio
47 High 38 39 24 25 29
48 Low 25 17 15 17 19