Lowe's 1999 Annual Report Download - page 32
Download and view the complete annual report
Please find page 32 of the 1999 Lowe's annual report below. You can navigate through the pages in the report by either clicking on the pages listed below, or by using the keyword search tool below to find specific information within the annual report.-
 1
1 -
2
-
3
-
4
-
5
-
6
-
7
-
8
-
9
-
10
-
11
-
12
-
13
-
14
-
15
-
16
-
17
-
18
-
19
-
20
-
21
-
 22
22 -
 23
23 -
 24
24 -
 25
25 -
 26
26 -
 27
27 -
 28
28 -
 29
29 -
 30
30 -
 31
31 -
 32
32 -
 33
33 -
 34
34 -
 35
35 -
 36
36 -
 37
37 -
 38
38 -
 39
39 -
 40
40
 |
 |

30
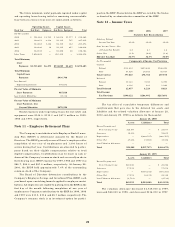
Note 13 – Litigation
The Company is a defendant in legal proceedings considered
to be in the normal course of business, none of which, singularly
or collectively, are considered material to the Company.
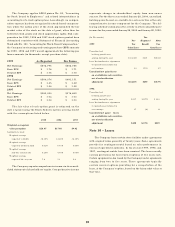
Note 14 – Other Information
Net interest expense is composed of the following:
1999 1998 1997
(In Thousands)
Long-Term Debt $86,675 $68,800 $40,139
Mortgage Interest 6,686 7,044 3,441
Capitalized Leases 42,552 39,255 38,447
Short-Term Debt 5,847 5,578 7,917
Amortization of Loan Costs 801 1,144 931
Interest Income (38,373) (23,300) (10,293)
Interest Capitalized (19,336) (17,580) (8,967)
Net Interest Expense $84,852 $80,941 $71,615
Supplemental Disclosures of Cash Flow Information:
1999 1998 1997
(In Thousands)
Cash Paid for Interest
(Net of Amount Capitalized) $128,265 $112,383 $ 83,209
Cash Paid for Income Taxes $408,366 $280,230 $209,620
Noncash Investing
and Financing Activities:
Fixed Assets Acquired
Under Capital Leases $ 27,573 $ 47,303 $ 32,738
Termination of Capital Leases — 10,401 —
Common Stock Issued to
ESOP (Note 11) 59,544 60,074 56,630
Common Stock Issued
to Executives and
Directors, net of
Unearned Compensation 12,488 17,853 6,407
Conversion of Debt
to Common Stock — 87,270 —
Notes Received in
Exchange for Assets 1,980 — 600
Notes Issued in
Exchange for Assets $ — $ 6,014 $ 2,200
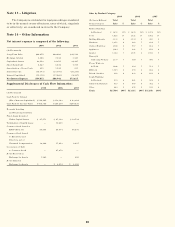
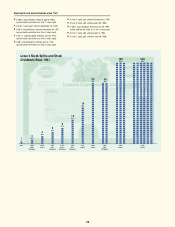
Sales by Product Category:
1999 1998 1997
(Dollars in Millions) Total Total Total
Product Category Sales % Sales % Sales %
Fashion Plumbing
& Electrical $ 1,803 11% $ 1,630 12% $ 1,372 12%
Tools 1,626 10 1,321 10 1,082 10
Building Materials 1,333 8 1,139 9 995 9
Hardware 1,251 8 983 7 804 7
Outdoor Hardlines 1,188 8 957 7 812 7
Appliances 1,169 7 921 7 676 6
Lumber 1,152 7 1,091 8 1,035 9
Nursery &
Gardening Products 1,133 7 989 7 786 7
Floors, W indows
& Walls 1,086 7 914 7 711 7
Millwork 1,020 6 803 6 664 6
Paint & Sundries 960 6 830 6 691 6
Rough Plumbing
& Electrical 910 6 681 5 562 5
Cabinets & Furniture 613 4 467 4 382 3
Other 662 5 605 5 536 6
Totals $15,906 100% $13,331 100% $11,108 100%