Lowe's 1999 Annual Report Download - page 37
Download and view the complete annual report
Please find page 37 of the 1999 Lowe's annual report below. You can navigate through the pages in the report by either clicking on the pages listed below, or by using the keyword search tool below to find specific information within the annual report.-
 1
1 -
2
-
3
-
4
-
5
-
6
-
7
-
8
-
9
-
10
-
11
-
12
-
13
-
14
-
15
-
16
-
17
-
18
-
19
-
20
-
21
-
22
-
23
-
24
-
25
-
26
-
 27
27 -
 28
28 -
 29
29 -
 30
30 -
 31
31 -
 32
32 -
 33
33 -
 34
34 -
 35
35 -
 36
36 -
 37
37 -
 38
38 -
 39
39 -
 40
40
 |
 |

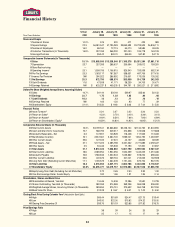
35
January 31, January 31, January 31, January 31, January 31,
1995 1994 1993 1992 1991
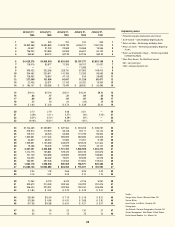
1355 324 310 310 309 1
220,852,368 15,694,889 10,828,722 8,505,121 7,061,925 2
340,637 31,243 22,569 18,968 15,556 3
4136,342 100,963 84,268 65,607 54,142 4
5$48.62 $48.15 $47.39 $47.36 $52.33 5
6 $ 6,629,276 $4,860,939 $3,993,699 $3,107,377 $2,833,108 6
7116,415 83,877 71,326 58,707 51,431 7
8— — — 71,288 — 8
9493,432 332,296 228,750 87,363 168,413 9
10 344,492 230,611 141,766 12,039 99,563 10
11 126,952 78,657 47,119 819 28,893 11
12 217,540 151,954 94,647 11,220 69,471 12
13 27,433 23,571 21,153 20,020 19,334 13
14 $ 190,107 $ 128,383 $ 73,494 $ (8,800) $ 55,496 14
15 $19.14 $15.19 $13.21 $10.34 $9.26 15
16 .63 .47 .31 .04 .23 16
17 .09 .07 .07 .07 .06 17
18 .55 .40 .24 (.02) .18 18
19 $ 4.63 $ 3.32 $ 2.76 $ 2.38 $2.30 19
20 2.70 2.79 2.66 2.54 — 20
21 3.28% 3.11% 2.37% .36% 2.45% 21
22 8.87% 8.72% 6.29% .92% — 22
23 20.48% 18.21% 13.24% 1.60% — 23
24 $1,744,465 $1,233,872 $ 827,344 $ 818,208 $ 636,781 24
25 273,914 110,920 56,128 33,111 50,144 25
26 109,214 48,500 53,288 115,739 96,354 26
27 1,332,831 1,017,424 690,859 662,885 494,328 27
28 34,857 68,513 37,863 15,357 9,159 28
29 1,559,851 1,120,339 832,679 623,678 541,464 29
30 79,466 58,009 57,929 50,762 45,127 30
31 3,467,241 2,452,628 1,741,222 1,503,998 1,223,372 31
32 1,014,775 735,861 529,475 605,139 337,676 32
33 721,149 503,696 349,693 319,859 186,860 33
34 144,554 86,482 75,670 62,639 44,578 34
35 784,991 597,248 313,562 113,650 159,204 35
36 1,864,118 1,390,530 906,569 788,971 520,380 36
37 $1,603,123 $1,062,098 $ 834,653 $ 715,027 $ 702,992 37
38 2.04 1.78 2.66 6.29 4.42 38
39 2.16 2.31 2.09 2.10 1.74 39
40 11,360 8,773 8,475 6,216 6,261 40
41 333,672 310,349 303,165 149,293 291,676 41
42 346,440 320,051 302,355 300,430 306,038 42
43 $ 4.80 $ 3.42 $ 2.75 $ 4.79 $ 2.41 43
44 $20.69 $15.50 $ 7.19 $ 5.18 $ 6.21 44
45 $13.88 $ 6.66 $ 4.00 $ 2.88 $ 2.30 45
46 $17.38 $14.88 $ 6.04 $ 4.27 $ 3.07 46
47 33 33 23 130 27 47
48 22 14 13 72 10 48
Explanatory notes
1Pretax Earnings plus Depreciation and Interest.
2Asset Turnover – Sales divided by Beginning Assets.
3Return on Sales – Net Earnings divided by Sales.
4Return on Assets – Net Earnings divided by Beginning
Assets.
5Return on Shareholders’ Equity – Net Earnings divided
by Beginning Equity.
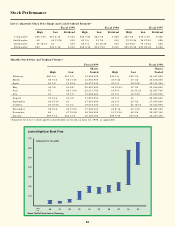
6Stock Price Source:
The Wall Street Journal
NM = not meaningful
CGR = compound growth rate
Credits:
Design:
Henry Church, Winston-Salem, NC
Feature Writer:
Karen Doyle, Just Write!, Charlotte, NC
Photography:
Joe Ciarlante, Ciarlante Photography, Charlotte, NC
Project Management:
Matt Phelan & Mark Phelan
Phelan Annual Reports, Inc., Atlanta, GA