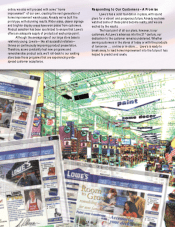
Lowe's 1999 Annual Report Download - page 19
Download and view the complete annual report
Please find page 19 of the 1999 Lowe's annual report below. You can navigate through the pages in the report by either clicking on the pages listed below, or by using the keyword search tool below to find specific information within the annual report.-
 1
1 -
2
-
3
-
4
-
5
-
6
-
7
-
8
-
 9
9 -
 10
10 -
 11
11 -
 12
12 -
 13
13 -
 14
14 -
 15
15 -
 16
16 -
 17
17 -
 18
18 -
 19
19 -
 20
20 -
 21
21 -
 22
22 -
 23
23 -
 24
24 -
 25
25 -
 26
26 -
 27
27 -
 28
28 -
 29
29 -
30
-
31
-
32
-
33
-
34
-
35
-
36
-
37
-
38
-
39
-
40
 |
 |

17
The Company’s 2000 capital budget is currently at $2.2
billion, inclusive of approximately $225 million of oper-
ating or capital leases. Approximately 85% of this planned
commitment is for store expansion and new distribution
centers. Expansion plans for 2000 consist of approximately
95 stores (including the relocation of 17 older, smaller
format stores). This planned expansion is expected to
increase sales floor square footage by approximately 18%.
Approximately 10% of the 2000 projects will be leased
and 90% will be owned. The Company has begun con-
struction on a regional distribution center located in Perris,
California. The 1.2 million square foot facility is expected
to be operational in the first quarter of 2001. During 2000,
construction will also begin on another distribution cen-
ter in Findlay, Ohio which is expected to be operational in
late 2001. At January 28, 2000, the Company operated
six regional distribution centers and nine smaller support
facilities. The Company believes that funds from opera-
tions, funds from debt issuances, leases and existing short-
term credit agreements will be adequate to finance the 2000
expansion plan and other operating requirements.
YEAR 2000
The Company, as well as most other businesses,
committed a significant amount of time and resources to
ensure that its information technology (IT) systems were
year 2000 compliant. The Company also took steps to
prevent or lessen any potential adverse effects on overall
operations, which included assessing the readiness of mer-
chandise vendors and other entities with which it does
business. As a result of these preparations, the Company
achieved a smooth transition into the year 2000.
Preparations for the year 2000 required expenditures
to convert the Company’s existing IT systems. These costs
have been estimated to total approximately $5 million and
were expensed as incurred. In addition, approximately $19
million of computer hardware was purchased to replace
existing non-compliant hardware. The cost of the new
hardware was capitalized and is being depreciated over
useful lives ranging from three to five years. The cost to
convert systems was mitigated by substantial investments
in new computer equipment over the past six years. The
Company continuously makes investments in technology
in order to improve customer service and the availability
of information to management.
MARKET RISK
During 1999 and 1998, the Company utilized an
interest rate swap agreement to manage interest rates on
certain mortgages. Variable rates on mortgages, totaling
$25 million, are being swapped for a fixed rate of 7.94%
until the year 2007. The swap agreement limits the
Company’s exposure to the possibility of rising interest rates.
The Company’s major market risk exposure is the
potential loss arising from changing interest rates and its
impact on long-term investments and long-term debt. The
Company’s policy is to manage interest rate risks by main-
taining a combination of fixed and variable rate financial
instruments. At January 28, 2000, long-term investments
consisted of $31.1 million in municipal obligations and
preferred stocks, classified as available-for-sale securities.
Although the fair value of these securities, like all fixed
income securities, would fall if interest rates increase, the
Company has the ability to hold its fixed income invest-
ments until maturity and not experience an adverse
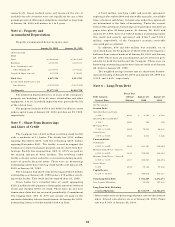
impact on earnings or cash flows. The following table
summarizes the Company’s market risks associated with
long-term debt. The table presents principal cash outflows
and related interest rates by year of maturity. Fair values
included below were determined using quoted market
rates or interest rates that are currently available to the
Company on debt with similar terms and remaining
maturities.
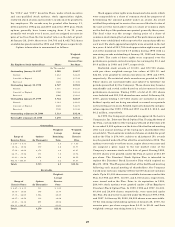
Long-Term Debt Maturities by Fiscal Year
(Dollars in Millions)
Avg. Avg.
Fixed Interest Variable Interest
Rate Rate Rate Rate
2000 $61.1 7.51% $0.2 4.25%
2001 43.3 8.27 0.1 4.25
2002 61.5 8.15 0.1 4.25
2003 31.8 8.67 0.1 4.25
2004 80.2 8.32 0.1 4.25
Thereafter 1,560.5 7.61% 2.2 3.63%
Total $1,838.4 $2.8
Fair Value $2,021.4 $2.8
NEW ACCOUNTING PRONOUNCEMENTS
Statement of Financial Accounting Standards No.
133, “Accounting for Derivative Instruments and Hedg-
ing Activities” (SFAS 133) was issued in June 1998.
SFAS 133 is effective for the Company in the year
beginning February 3, 2001. SFAS 133 requires that an
entity recognize all derivatives as either assets or liabili-
ties in the balance sheet and measure those instruments
at fair value. Management is currently evaluating the
impact of the adoption of SFAS 133 and its effect on the
Company’s financial statements.