Lowe's 1999 Annual Report Download - page 30
Download and view the complete annual report
Please find page 30 of the 1999 Lowe's annual report below. You can navigate through the pages in the report by either clicking on the pages listed below, or by using the keyword search tool below to find specific information within the annual report.-
 1
1 -
2
-
3
-
4
-
5
-
6
-
7
-
8
-
9
-
10
-
11
-
12
-
13
-
14
-
15
-
16
-
17
-
18
-
19
-
 20
20 -
 21
21 -
 22
22 -
 23
23 -
 24
24 -
 25
25 -
 26
26 -
 27
27 -
 28
28 -
 29
29 -
 30
30 -
 31
31 -
 32
32 -
 33
33 -
 34
34 -
 35
35 -
 36
36 -
 37
37 -
 38
38 -
 39
39 -
 40
40
 |
 |

28
The Company applies APB Opinion No. 25, “Accounting
for Stock Issued to Employees,” and related interpretations in
accounting for its stock option plans. Accordingly, no compen-
sation expense has been recognized for stock-based compensa-
tion where the option price of the stock approximated the fair
market value of the stock on the date of grant, other than for
restricted stock grants and stock appreciation rights. Had com-
pensation for 1999, 1998 and 1997 stock options granted been
determined consistent with Statement of Financial Accounting
Standards No. 123, “Accounting for Stock-Based Compensation,”
the Co mpany’s net earnings and earnings per share (EPS) amounts
for 1999, 1998 and 1997 would approximate the following pro
forma amounts (in thousands, except per share data):
1999 As Reported Pro Forma
Net Earnings $672,795 $652,786
Basic EPS $ 1.76 $ 1.71
Diluted EPS $ 1.75 $ 1.70
1998
Net Earnings $500,374 $491,151
Basic EPS $ 1.35 $ 1.32
Diluted EPS $ 1.34 $ 1.32
1997
Net Earnings $383,030 $376,609
Basic EPS $ 1.04 $ 1.03
Diluted EPS $ 1.04 $ 1.03
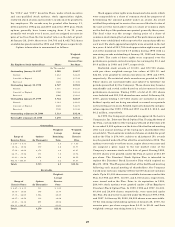
The fair value of each option grant is estimated on the
date of grant using the Black-Scholes option-pricing model
with the assumptions listed below.
1999 1998 1997
Weighted average fair
value per option $26.05 $17.48 $9.42
Assumptions used:
Weighted average
expected volatility 38.10% 34.20% 36.10%
Weighted average
expected dividend yield 0.52% 0.31% 0.55%
Weighted average
risk-free interest rate 6.24% 4.78% 6.06%
Weighted average
expected life, in years 7.0 7.3 5.4
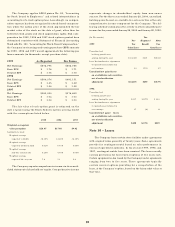
The Company reports comprehensive income in its consoli-
dated statement of shareholders’ equity. Co mprehensive income
represents changes in shareholders’ equity from non-owner
sources. For the three years ended January 28, 2000, unrealized
holding gains (losses) on available-for-sale securities is the only
comprehensive income component for the Company. The fol-
lowing schedule summarizes the activity in other comprehensive
income for the years ended January 28, 2000 and January 29, 1999:
(In Thousands) Tax
Pre- (Expense)/ After
1999 Tax Benefit Tax
Gain/(Loss) Gain/(Loss)
Unrealized net
holding gains/losses
arising during the year $(1,245) $435 $(810)
Less: Reclassification adjustment
for gains/losses included in
net earnings 42 (15) 27
Unrealized net gains/losses
on available-for-sale securities,
net of reclassification
adjustment $(1,287) $450 $(837)
1998
Unrealized net
holding gains/losses
arising during the year $417 $(177) $ 240
Less: Reclassification adjustment
for gains/losses included in
net earnings 17 (6) 11
Unrealized net gains/ losses
on available-for-sale securities,
net of reclassification
adjustment $400 $(171) $229
Note 10 – Leases
The Company leases certain store facilities under agreements
with original terms generally of twenty years. Some agreements
provide for contingent rental based on sales performance in
excess of specified minimums. In fiscal years 1999, 1998, and
1997, contingent rentals have been nominal. The leases usually
contain provisions for four renewal options of five years each.
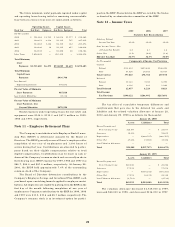
Certain equipment is also leased by the Company under agreements
ranging from two to five years. These agreements typically
contain renewal options providing for a renegotiation of the
lease, at the Company’s option, based on the fair market value at
that time.