Lowe's 1999 Annual Report Download - page 33
Download and view the complete annual report
Please find page 33 of the 1999 Lowe's annual report below. You can navigate through the pages in the report by either clicking on the pages listed below, or by using the keyword search tool below to find specific information within the annual report.-
 1
1 -
2
-
3
-
4
-
5
-
6
-
7
-
8
-
9
-
10
-
11
-
12
-
13
-
14
-
15
-
16
-
17
-
18
-
19
-
20
-
21
-
22
-
 23
23 -
 24
24 -
 25
25 -
 26
26 -
 27
27 -
 28
28 -
 29
29 -
 30
30 -
 31
31 -
 32
32 -
 33
33 -
 34
34 -
 35
35 -
 36
36 -
 37
37 -
 38
38 -
 39
39 -
 40
40
 |
 |

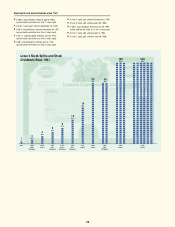
31
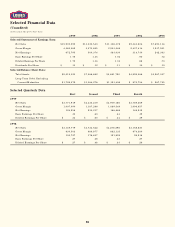
Earnings Statement
In Thousands, Except Per Share Data
Quarter Ended 1/28/00 10/29/99 7/30/99 4/30/99 1/29/99 10/30/98 7/31/98 5/1/98
Earnings Statement Changes
Changes from Same Quarter Previous Year, to Nearest Tenth Percent
Quarter Ended 1/28/00 10/29/99 7/30/99 4/30/99 1/29/99 10/30/98 7/31/98 5/1/98
Quarterly Review of Performance
(Unaudited)
Net Sales $3,789,269 $3,909,188 $4,435,219 $3,771,919 $3,168,821 $3,278,298 $3,733,642 $3,149,779
Gross Margin 1,096,657 1,089,549 1,187,286 1,007,090 874,380 882,135 986,877 830,503
Expenses:
S,G & A 710,862 692,394 704,821 664,351 591,438 578,362 602,055 569,555
Store Opening Costs 39,051 25,722 15,465 18,210 27,878 20,345 14,952 12,395
Depreciation 91,276 86,440 81,723 77,920 76,456 72,848 70,455 68,848
Interest 20,528 18,921 22,096 23,307 21,209 19,282 18,810 21,639
Nonrecurring Merger Costs — — — 24,378 — — — —
Total Expenses 861,717 823,477 824,105 808,166 716,981 690,837 706,272 672,437
Pre-Tax Earnings 234,940 266,072 363,181 198,924 157,399 191,298 280,605 158,066
Income Tax Provision 86,008 97,384 132,964 73,966 58,479 69,406 101,768 57,339
Net Earnings $ 148,932 $ 168,688 $ 230,217 $ 124,958 $ 98,920 $ 121,892 $ 178,837 $ 100,727
Basic Earnings
Per Share $ .39 $ .44 $ .60 $ .33 $ .27 $ .33 $ .48 $ .27
Diluted Earnings
Per Share $ .39 $ .44 $ .60 $ .33 $ .26 $ .33 $ .48 $ .27
Fiscal 1998
Fiscal 1998
Net Sales 19.6% 19.2% 18.8% 19.8% 20.9% 17.9% 21.0% 20.1%
Gross Margin 25.4 23.5 20.3 21.3 22.7 19.1 21.6 20.7
Expenses:
S,G & A 20.2 19.7 17.1 16.6 20.7 18.9 20.6 18.9
Store Opening Costs 40.1 26.4 3.4 49.9 1.9 (10.3) 21.7 19.9
Depreciation 19.4 18.7 16.0 13.2 10.9 13.2 13.2 14.5
Interest (3.2) (1.9) 17.5 7.7 12.6 16.6 7.3 15.7
Nonrecurring Merger Costs — — — 100.0 — — — —
Total Expenses 20.2 19.2 16.7 20.2 18.5 17.1 19.5 18.4
Pre-Tax Earnings 49.3 39.1 29.4 25.8 46.0 27.0 27.3 32.0
Income Tax Provision 47.1 40.3 30.7 29.0 47.4 29.0 28.9 32.9
Net Earnings 50.6 38.4 28.7 24.1 45.3 25.8 26.4 31.5
Basic Earnings
Per Share 44.4 33.3 25.0 22.2 50.0 26.9 23.1 30.0
Diluted Earnings
Per Share 50.0% 33.3% 25.0% 22.2% 36.8% 26.9% 26.3% 29.6%
Earnings Statement Percentages
Percent of Sales to Nearest Hundredth; Income Tax is % of Pre-Tax Earnings
Quarter Ended 1/28/00 10/29/99 7/30/99 4/30/99 1/29/99 10/30/98 7/31/98 5/1/98
Fiscal 1998Fiscal 1999
Net Sales 100.00% 100.00% 100.00% 100.00% 100.00% 100.00% 100.00% 100.00%
Gross Margin 28.94 27.87 26.77 26.70 27.59 26.91 26.43 26.37
Expenses:
S,G & A 18.76 17.71 15.89 17.61 18.66 17.64 16.13 18.08
Store Opening Costs 1.03 .66 .35 .48 .88 .62 .40 .39
Depreciation 2.41 2.21 1.84 2.07 2.41 2.22 1.89 2.19
Interest .54 .48 .50 .62 .67 .59 .50 .69
Nonrecurring Merger Costs — — — .65 — — — —
Total Expenses 22.74 21.06 18.58 21.43 22.62 21.07 18.92 21.35
Pre-Tax Earnings 6.20 6.81 8.19 5.27 4.97 5.84 7.52 5.02
Income Tax Provision 36.61 36.60 36.61 37.18 37.15 36.28 36.27 36.28
Net Earnings 3.93% 4.32% 5.19% 3.31% 3.12% 3.72% 4.79% 3.20%
Fiscal 1999
Fiscal 1999