Lowe's 1999 Annual Report Download - page 20
Download and view the complete annual report
Please find page 20 of the 1999 Lowe's annual report below. You can navigate through the pages in the report by either clicking on the pages listed below, or by using the keyword search tool below to find specific information within the annual report.-
 1
1 -
2
-
3
-
4
-
5
-
6
-
7
-
8
-
9
-
 10
10 -
 11
11 -
 12
12 -
 13
13 -
 14
14 -
 15
15 -
 16
16 -
 17
17 -
 18
18 -
 19
19 -
 20
20 -
 21
21 -
 22
22 -
 23
23 -
 24
24 -
 25
25 -
 26
26 -
 27
27 -
 28
28 -
 29
29 -
 30
30 -
31
-
32
-
33
-
34
-
35
-
36
-
37
-
38
-
39
-
40
 |
 |
18
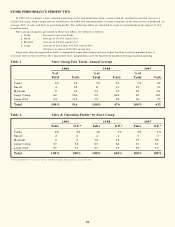
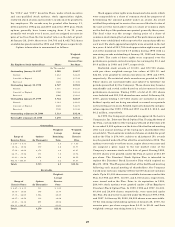
STORE PERFORMANCE PERSPECTIVE
In 1992, Lowe’s began a more detailed reporting on the transformation from a chain of small, contractor-oriented stores to a
family of modern, home-improvement warehouses. In 1999, the transformation is nearly complete as the large stores contributed, on
average, 88% of sales and 86% of operating profits. The following tables are intended to assist in understanding the impact of that
transformation.
Store group categories, presented in these two tables, are defined as follows:
1. Yards : Focused Contractor Yards
2. Small : Average of 18,000 square feet
3. Medium : Average of 54,000 square feet
4. Large : Average of more than 100,000 square feet
All stores in excess of 80,000 square feet
Large store sales are reported on both a comparable (same store) basis and new (open less than fourteen months) basis. A
relocated store is removed from the comparable store computation until the fourteenth month following its grand opening.
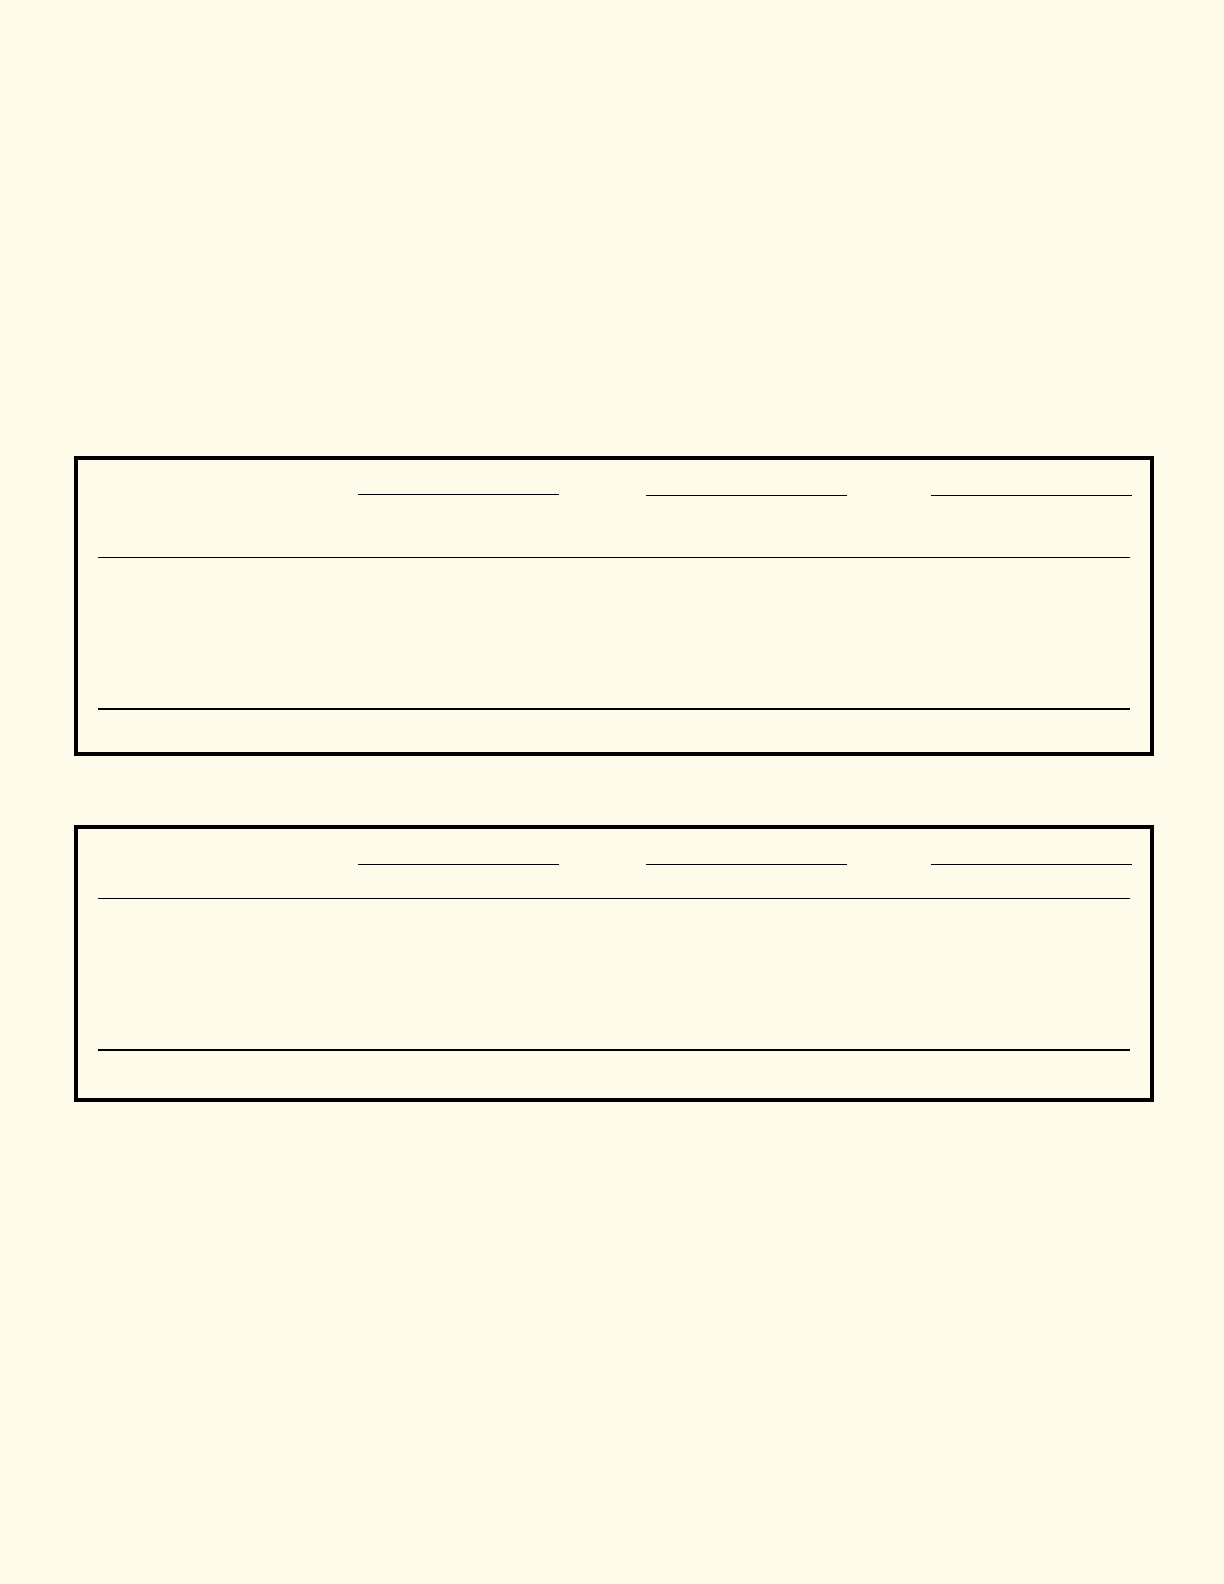
Table 1 Store Group Unit Totals, Annual Average
Table 2 Sales & Operating Profits* by Store Group
*Operating Profits before corporate expense and intercompany charges, interest, and income taxes.
1999 1998 1997
% of % of % of
Total Units Total Units Total Units
Yards 6% 32 7% 31 7% 29
Small 4 23 8 41 13 55
Medium 8 45 14 67 19 84
Large Comp 60 304 52 245 43 187
Large New 22 112 19 90 18 77
Total 100% 516 100% 474 100% 432
1999 1998 1997
Sales O.P.* Sales O.P.* Sales O.P.*
Yards 4% 3% 4% 3% 4% 3%
Small 2 2 4 4 7 7
Medium 6 9 12 16 19 26
Large Comp 67 72 60 64 51 54
Large New 21 14 20 13 19 10
Total 100% 100% 100% 100% 100% 100%