Proctor and Gamble 2007 Annual Report Download - page 33
Download and view the complete annual report
Please find page 33 of the 2007 Proctor and Gamble annual report below. You can navigate through the pages in the report by either clicking on the pages listed below, or by using the keyword search tool below to find specific information within the annual report.-
 1
1 -
2
-
3
-
4
-
5
-
6
-
7
-
8
-
9
-
10
-
11
-
12
-
13
-
14
-
15
-
16
-
17
-
18
-
19
-
20
-
21
-
22
-
 23
23 -
 24
24 -
 25
25 -
 26
26 -
 27
27 -
 28
28 -
 29
29 -
 30
30 -
 31
31 -
 32
32 -
 33
33 -
 34
34 -
 35
35 -
 36
36 -
 37
37 -
 38
38 -
 39
39 -
 40
40 -
 41
41 -
 42
42 -
 43
43 -
44
-
45
-
46
-
47
-
48
-
49
-
50
-
51
-
52
-
53
-
54
-
55
-
56
-
57
-
58
-
59
-
60
-
61
-
62
-
63
-
64
-
65
-
66
-
67
-
68
-
69
-
70
-
71
-
72
-
73
-
74
-
75
-
76
-
77
-
78
 |
 |
The Procter & Gamble Company 31
The purpose of this discussion is to provide an understanding of P&G’s
nancial results and condition by focusing on changes in certain key
measures from year to year. Management’s Discussion and Analysis
(MD&A) is organized in the following sections:
Overview
Summary of 2007 Results
Forward-Looking Statements
Results of Operations
Segment Results
Financial Condition
Signicant Accounting Policies and Estimates
Other Information
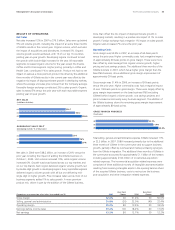
Throughout MD&A, we refer to measures used by management to
evaluate performance including unit volume growth, net outside sales
and after-tax prot. We also refer to organic sales growth, free cash
ow and free cash ow productivity. These nancial measures are not
dened under accounting principles generally accepted in the United
States of America (U.S. GAAP). The explanation of these measures at
the end of MD&A provides more details on the use and the derivation
of these measures. Management also uses certain market share and
market consumption estimates to evaluate performance relative to
competition despite some limitations on the availability and comparability
of share information. References to market share and market
consumption in MD&A are based on a combination of vendor-reported
consumption and market size data, as well as internal estimates.
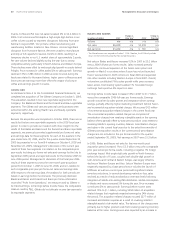
On October 1, 2005, we completed the acquisition of The Gillette
Company for $53.4 billion. Our Consolidated Financial Statements for
2006 and the related discussion of the total Company results within
MD&A include the results of the Gillette business for the nine-month
period from October 1, 2005 (the acquisition date) through June 30,
2006. In order to provide our investors with more insight into the
results of the Blades and Razors and the Duracell and Braun reportable
segments, we previously provided supplemental pro forma net sales
and earnings data for these segments for each of the quarters in the
year ended June 30, 2005, and for the quarter ended September 30,
2005 (as presented in our Form 8-K releases on October 4, 2005 and
November 22, 2005). Management’s discussion of the current year
results of these two segments is in relation to the comparable prior
year results including pro forma net sales and earnings for the July to
September 2005 period and reported results for the October 2005 to
June 2006 period. Management’s discussion of the scal year 2006
results of these segments covers the nine-month post-acquisition period
from October 1, 2005, to June 30, 2006, and is in relation to such
comparable prior year pro forma net sales and earnings data. Results
of Gillette’s personal care and oral care businesses were subsumed
within the Beauty and Health Care reportable segments, respectively.
P&G’s business is focused on providing branded consumer goods
products. Our goal is to provide products of superior quality and value
to improve the lives of the world’s consumers. We believe this will result
in leadership sales, prots and value creation, allowing employees,
shareholders and the communities in which we operate to prosper.
Our products are sold in more than 180 countries primarily through mass
merchandisers, grocery stores, membership club stores and drug stores.
We continue to expand our presence in “high frequency stores,” the
neighborhood stores which serve many consumers in developing
markets. We have on-the-ground operations in over 80 countries.
Our market environment is highly competitive, with global, regional
and local competitors. In many of the markets and industry segments
in which we sell our products, we compete against other branded
products as well as retailers’ private-label brands. Additionally, many
of the product segments in which we compete are differentiated by
price (referred to as premium, mid-tier and value-tier products).
Generally speaking, we compete with premium and mid-tier products
and are well positioned in the industry segments and markets in which
we operate
—
often holding a leadership or signicant share position.
In scal 2007, our organizational structure was comprised of three
Global Business Units (GBUs) and a Global Operations group.
The Global Operations group consisted of the Market Development
Organization (MDO) and Global Business Services (GBS). The heads
of the three GBUs and Global Operations each reported to the
Chief Executive Ofcer.
Through 2007, our three GBUs were Beauty and Health, Household
Care and Gillette GBU. The primary responsibility of the GBUs is to
develop the overall strategy for our brands. They identify common
consumer needs, develop new product innovations and build our
brands through effective commercial innovations, marketing and sales.
Under U.S. GAAP, the business units comprising the GBUs are
aggregated into seven reportable segments: Beauty; Health Care;
Fabric Care and Home Care; Baby Care and Family Care; Snacks, Coffee
and Pet Care; Blades and Razors; and Duracell and Braun. The following
provides additional detail on the reportable segments and brand
composition of each of our three GBUs: