Proctor and Gamble 2007 Annual Report Download - page 4
Download and view the complete annual report
Please find page 4 of the 2007 Proctor and Gamble annual report below. You can navigate through the pages in the report by either clicking on the pages listed below, or by using the keyword search tool below to find specific information within the annual report.-
 1
1 -
 2
2 -
 3
3 -
 4
4 -
 5
5 -
 6
6 -
 7
7 -
 8
8 -
 9
9 -
 10
10 -
 11
11 -
 12
12 -
 13
13 -
 14
14 -
 15
15 -
16
-
17
-
18
-
19
-
20
-
21
-
22
-
23
-
24
-
25
-
26
-
27
-
28
-
29
-
30
-
31
-
32
-
33
-
34
-
35
-
36
-
37
-
38
-
39
-
40
-
41
-
42
-
43
-
44
-
45
-
46
-
47
-
48
-
49
-
50
-
51
-
52
-
53
-
54
-
55
-
56
-
57
-
58
-
59
-
60
-
61
-
62
-
63
-
64
-
65
-
66
-
67
-
68
-
69
-
70
-
71
-
72
-
73
-
74
-
75
-
76
-
77
-
78
 |
 |
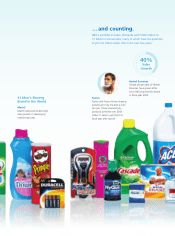
We’ve grown P&G sales from $39 billion to $76 billion in the past seven years.
We’ve more than doubled the number of brands that generate $1 billion or more
in sales each year, and now have 23 of these leading billion-dollar brands in our
portfolio. We’ve more than quadrupled the number of brands that generate at
least $500 million in sales, and now have 18 of these brands poised to be our
next billion-dollar brands. We’ve nearly doubled the number of countries in which
P&G generates a billion dollars or more in sales each year, and now have 12 billion-
dollar countries. We do more than a billion dollars in sales each year with seven
retail customers, up from two in 2001. We’ve generated more than $43 billion in
net earnings and $50 billion in free cash ow. P&G’s market capitalization has
increased more than $100 billion since 2001, and today the Company is among
the ten most valuable companies in the U.S.
The critical question now for P&G shareholders, prospective investors, and Company
management is: “How do we keep a company of P&G’s size growing?”
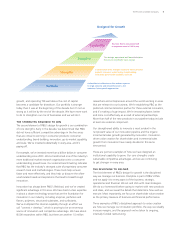
designed&
We’ve designed a diversied business portfolio to grow
consistently and reliably. We’ve designed the core strengths we
need to win in our industry. We’ve designed strategic, operational
and nancial processes that ensure discipline to deliver. And
we’ve designed a management team and organization to lead.
With clear choices, smart and sufcient investments, and an
unwavering focus on the long-term health of our business,
we have designed P&G to meet or exceed its growth targets
reliably year after year.
2007 was a good example of how P&G’s design for growth
works. It was the most demanding year we’ve faced since the
beginning of the decade. Energy and commodity costs continued
to rise. Competitive pressure intensied. We had to complete the
vast majority of work to integrate Gillette. And yet, we continued
to grow well within the Company’s target growth range.
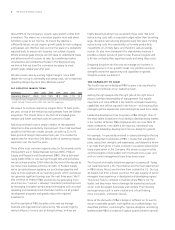
Net sales increased 12%, to $76 billion. Organic sales
increased 5%.
Note: An explanation and reconciliation of free cash ow and organic sales for 2007 is provided on pages 47-48.
The Procter & Gamble Company
2