Proctor and Gamble 2007 Annual Report Download - page 54
Download and view the complete annual report
Please find page 54 of the 2007 Proctor and Gamble annual report below. You can navigate through the pages in the report by either clicking on the pages listed below, or by using the keyword search tool below to find specific information within the annual report.-
 1
1 -
2
-
3
-
4
-
5
-
6
-
7
-
8
-
9
-
10
-
11
-
12
-
13
-
14
-
15
-
16
-
17
-
18
-
19
-
20
-
21
-
22
-
23
-
24
-
25
-
26
-
27
-
28
-
29
-
30
-
31
-
32
-
33
-
34
-
35
-
36
-
37
-
38
-
39
-
40
-
41
-
42
-
43
-
 44
44 -
 45
45 -
 46
46 -
 47
47 -
 48
48 -
 49
49 -
 50
50 -
 51
51 -
 52
52 -
 53
53 -
 54
54 -
 55
55 -
 56
56 -
 57
57 -
 58
58 -
 59
59 -
 60
60 -
 61
61 -
 62
62 -
 63
63 -
 64
64 -
65
-
66
-
67
-
68
-
69
-
70
-
71
-
72
-
73
-
74
-
75
-
76
-
77
-
78
 |
 |

The Procter & Gamble Company
52
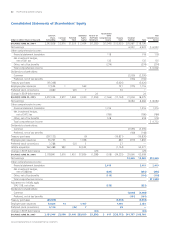
See accompanying Notes to Consolidated Financial Statements.
Total
Comprehensive
Income
$ 6,923
118
135
(274)
$ 6,902
$ 8,684
1,316
(786)
518
$ 9,732
Accumulated
Common Additional Reserve for Other
Shares Common Preferred Paid-In ESOP Debt Comprehensive Treasury Retained
Dollars in millions / Shares in thousands Outstanding Stock Stock Capital Retirement Income Stock Earnings Total
2,543,838 $2,976 $1,526 $ 2,454 $(1,283) $(1,545) $(12,925) $26,987 $ 18,190
Net earnings 6,923 6,923
Other comprehensive income:
Financial statement translation 118 118
Net investment hedges,
net of $81 tax 135 135
Other, net of tax benefits (274) (274)
Total comprehensive income
Dividends to shareholders:
Common (2,595) (2,595)
Preferred, net of tax benefits (136) (136)
Treasury purchases (93,308) (5,026) (5,026)
Employee plan issuances 17,524 1 569 721 (175) 1,116
Preferred stock conversions 4,880 (43) 7 36
—
Change in ESOP debt reserve 24 24
2,472,934 2,977 1,483 3,030 (1,259) (1,566) (17,194) 31,004 18,475
Net earnings 8,684 8,684
Other comprehensive income:
Financial statement translation 1,316 1,316
Net investment hedges,
net of $472 tax (786) (786)
Other, net of tax benefits 518 518
Total comprehensive income
Dividends to shareholders:
Common (3,555) (3,555)
Preferred, net of tax benefits (148) (148)
Treasury purchases (297,132) (9) (16,821) (16,830)
Employee plan issuances 36,763 16 1,308 887 (319) 1,892
Preferred stock conversions 3,788 (32) 5 27
—
Gillette acquisition 962,488 983 53,522 (1,134) 53,371
Change in ESOP debt reserve (29) (29)
3,178,841 3,976 1,451 57,856 (1,288) (518) (34,235) 35,666 62,908
Net earnings
Other comprehensive income:
Financial statement translation
Net investment hedges,
net of $488 tax
Other, net of tax benefits
Total comprehensive income
Adjustment to initially apply
SFAS 158, net of tax
Dividends to shareholders:
Common
Preferred, net of tax benefits
Treasury purchases
Employee plan issuances
Preferred stock conversions
Change in ESOP debt reserve