Proctor and Gamble 2007 Annual Report Download - page 44
Download and view the complete annual report
Please find page 44 of the 2007 Proctor and Gamble annual report below. You can navigate through the pages in the report by either clicking on the pages listed below, or by using the keyword search tool below to find specific information within the annual report.-
 1
1 -
2
-
3
-
4
-
5
-
6
-
7
-
8
-
9
-
10
-
11
-
12
-
13
-
14
-
15
-
16
-
17
-
18
-
19
-
20
-
21
-
22
-
23
-
24
-
25
-
26
-
27
-
28
-
29
-
30
-
31
-
32
-
33
-
 34
34 -
 35
35 -
 36
36 -
 37
37 -
 38
38 -
 39
39 -
 40
40 -
 41
41 -
 42
42 -
 43
43 -
 44
44 -
 45
45 -
 46
46 -
 47
47 -
 48
48 -
 49
49 -
 50
50 -
 51
51 -
 52
52 -
 53
53 -
 54
54 -
55
-
56
-
57
-
58
-
59
-
60
-
61
-
62
-
63
-
64
-
65
-
66
-
67
-
68
-
69
-
70
-
71
-
72
-
73
-
74
-
75
-
76
-
77
-
78
 |
 |

The Procter & Gamble Company
42 Management’s Discussion and Analysis
Corporate net sales primarily reect the adjustment to eliminate the
sales of unconsolidated entities included in business unit results.
Corporate segment net earnings declined $235 million in 2007
primarily due to higher interest expenses and higher Gillette integration
costs. Interest expense was up $185 million primarily due to the
nancing costs associated with the debt issued to fund the share
repurchase program announced in conjunction with the Gillette
acquisition. We expect ongoing corporate restructuring spending to
increase to approximately $300 – $400 million after-tax, versus our
historical levels of $150 – $200 million after-tax.
In 2006, net earnings in the Corporate segment declined by $286 million
primarily due to an increase in net interest expense for debt to fund
the share repurchase program and the gain on the sale of the Juice
business in 2005.
We believe our nancial condition continues to be of high quality, as
evidenced by our ability to generate substantial cash from operations
and ready access to capital markets at competitive rates.
Operating cash ow provides the primary source of funds to nance
operating needs and capital expenditures. Excess operating cash is
used rst to fund shareholder dividends. Other discretionary uses
include share repurchases and “tack-on” acquisitions to complement
our portfolio of brands and geographies. As necessary, we may
supplement operating cash ow with debt to fund these activities.
The overall cash position of the Company reects our strong business
results and a global cash management strategy that takes into account
liquidity management, economic factors and tax considerations.
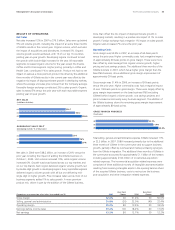
Operating cash ow in 2007 increased 18% to $13.4 billion.
Operating cash ow increased as a result of higher net earnings,
including the benet of an additional three months of Gillette in 2007.
Net earnings, adjusted for non-cash items (primarily depreciation and
amortization, share-based compensation and deferred income taxes)
was partially offset by cash used to fund working capital. Working
capital increased in 2007 primarily to support business growth. Accounts
receivable increased by one day largely due to disproportionate
growth in our Western European prestige fragrance business, which
has longer payment terms than the balance of our business. Inventory
increased during the year, primarily to support business growth.
Accounts payable, accrued and other liabilities was a net use of cash as
higher accounts payables, resulting from increased levels of marketing
investments late in the scal year and extended payment terms on
certain types of purchases, were more than offset by reduced tax
accruals driven by the timing of tax payments.
Operating cash ow in 2006 was $11.4 billion compared to $8.7 billion
in 2005, an increase of 31%. Operating cash ow increased behind
higher net earnings, including the benet of adding Gillette, and
lower working capital as improvements in inventory and accounts
payable more than offset an increase in accounts receivable.
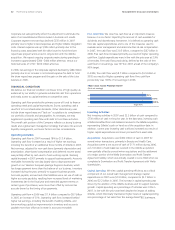
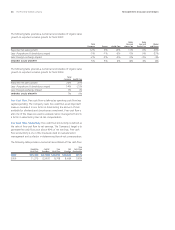
Free Cash Flow. We view free cash ow as an important measure
because it is one factor impacting the amount of cash available for
dividends and discretionary investment. It is dened as operating cash
ow less capital expenditures and is one of the measures used to
evaluate senior management and determine their at-risk compensation.
In 2007, free cash ow was $10.5 billion, compared to $8.7 billion in
2006. Free cash ow increased primarily as a result of higher operating
cash ow. Capital expenditures were in line with the prior year at 3.9%
of net sales. Free cash ow productivity, dened as the ratio of free
cash ow to net earnings, was 101% in 2007, ahead of the Company’s
90% target.
In 2006, free cash ow was $8.7 billion compared to $6.5 billion in
2005 as a result of higher operating cash ow. Free cash ow
productivity was 100% of net earnings in 2006.
IVg\Zi.%
.)
&%&
&%%
%*
%,
%+
;G::86H=;ADLEGD9J8I>K>IN
d[cZiZVgc^c\h
Net investing activities in 2007 used $2.5 billion of cash compared to
$730 million of cash in the prior year. In the base year, investing cash
activities beneted from cash balances received in the Gillette acquisition,
representing Gillette’s cash on hand as of the acquisition date. In
addition, current year investing cash outows increased as a result of
higher capital expenditures and lower proceeds from asset sales.
Acquisitions. Acquisitions used $492 million of cash in 2007 for
several minor transactions, primarily in Beauty and Health Care.
Acquisitions were a net source of cash of $171 million during 2006,
as $1.6 billion of cash balances received in the Gillette acquisition
were partially offset by several minor acquisitions and the settlement
of a major portion of the Wella Domination and Prot Transfer
Agreement liability, which was initially created in June 2004 when we
completed a Domination and Prot Transfer Agreement with Wella
shareholders.
Capital Spending. We view capital spending efciency as a critical
component of our overall cash management strategy. Capital
expenditures in 2007 were $2.9 billion, compared to $2.7 billion in
2006 and $2.2 billion in 2005. The increase in capital spending was
driven by the addition of the Gillette business and to support business
growth. Capital spending as a percentage of net sales was 3.9% in
2007, in line with the prior year level despite the impact of adding
Gillette, which historically maintained higher levels of capital spending
as a percentage of net sales than the average base P&G businesses.