Proctor and Gamble 2007 Annual Report Download - page 61
Download and view the complete annual report
Please find page 61 of the 2007 Proctor and Gamble annual report below. You can navigate through the pages in the report by either clicking on the pages listed below, or by using the keyword search tool below to find specific information within the annual report.-
 1
1 -
2
-
3
-
4
-
5
-
6
-
7
-
8
-
9
-
10
-
11
-
12
-
13
-
14
-
15
-
16
-
17
-
18
-
19
-
20
-
21
-
22
-
23
-
24
-
25
-
26
-
27
-
28
-
29
-
30
-
31
-
32
-
33
-
34
-
35
-
36
-
37
-
38
-
39
-
40
-
41
-
42
-
43
-
44
-
45
-
46
-
47
-
48
-
49
-
50
-
 51
51 -
 52
52 -
 53
53 -
 54
54 -
 55
55 -
 56
56 -
 57
57 -
 58
58 -
 59
59 -
 60
60 -
 61
61 -
 62
62 -
 63
63 -
 64
64 -
 65
65 -
 66
66 -
 67
67 -
 68
68 -
 69
69 -
 70
70 -
 71
71 -
72
-
73
-
74
-
75
-
76
-
77
-
78
 |
 |

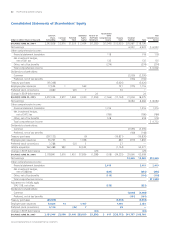
Millions of dollars except per share amounts or as otherwise specied.
Notes to Consolidated Financial Statements The Procter & Gamble Company 59
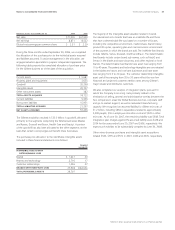
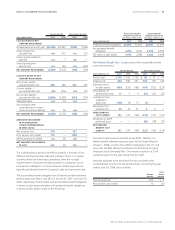
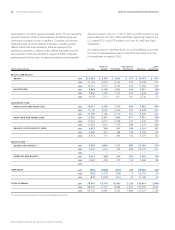
NOTE 5
June 30 2006
Current portion of long-term debt $1,930
USD commercial paper
—
Other 198
2,128
The weighted average short-term interest rates were 5.0% and 5.3%
as of June 30, 2007 and 2006, respectively, including the effects of
interest rate swaps discussed in Note 6.
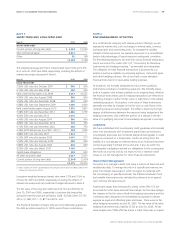
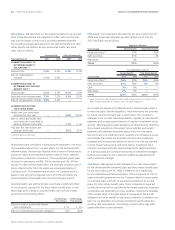
June 30 2006
3.50% USD note due October 2007 $ 500
6.13% USD note due May 2008 500
Bank credit facility expires July 2008 19,555
4.30% USD note due August 2008 500
3.50% USD note due December 2008 650
6.88% USD note due September 2009 1,000
Bank credit facility expires August 2010 1,857
3.38% EUR note due December 2012 1,779
4.50% EUR note due May 2014
—
4.95% USD note due August 2014 900
4.85% USD note due December 2015 700
4.13% EUR note due December 2020 763
9.36% ESOP debentures due 2007 – 2021 (1) 1,000
4.88% EUR note due May 2027
—
6.25% GBP note due January 2030 917
5.50% USD note due February 2034 500
5.80% USD note due August 2034 600
5.55% USD note due March 2037
—
Capital lease obligations 632
All other long-term debt 5,553
Current portion of long-term debt (1,930)
35,976
(1) Debt issued by the ESOP is guaranteed by the Company and must be recorded as debt of the
Company as discussed in Note 9.
Long-term weighted average interest rates were 3.3% and 3.6% as
of June 30, 2007 and 2006, respectively, including the effects of
interest rate swaps and net investment hedges discussed in Note 6.
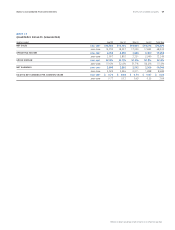
The fair value of the long-term debt was $23,122 and $36,027 at
June 30, 2007 and 2006, respectively. Long-term debt maturities
during the next ve years are as follows: 2008 – $2,544; 2009 – $5,751;
2010 – $1,982; 2011 – $1,877 and 2012 – $67.
The Procter & Gamble Company fully and unconditionally guarantees
the debt securities issued by its 100% owned nance subsidiaries.
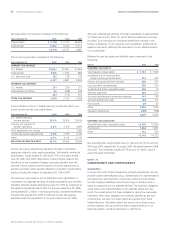
NOTE 6
As a multinational company with diverse product offerings, we are
exposed to market risks, such as changes in interest rates, currency
exchange rates and commodity prices. To manage the volatility
related to these exposures, we evaluate exposures on a consolidated
basis to take advantage of logical exposure netting and correlation.
For the remaining exposures, we enter into various nancial transactions,
which we account for under SFAS 133, “Accounting for Derivative
Instruments and Hedging Activities,” as amended and interpreted.
The utilization of these nancial transactions is governed by our
policies covering acceptable counterparty exposure, instrument types
and other hedging practices. We do not hold or issue derivative
nancial instruments for speculative trading purposes.
At inception, we formally designate and document qualifying
instruments as hedges of underlying exposures. We formally assess,
both at inception and at least quarterly on an ongoing basis, whether
the nancial instruments used in hedging transactions are effective at
offsetting changes in either the fair value or cash ows of the related
underlying exposure. Fluctuations in the value of these instruments
generally are offset by changes in the fair value or cash ows of the
underlying exposures being hedged. This offset is driven by the high
degree of effectiveness between the exposure being hedged and the
hedging instrument. Any ineffective portion of a change in the fair
value of a qualifying instrument is immediately recognized in earnings.
We have established strict counterparty credit guidelines and normally
enter into transactions with investment grade nancial institutions.
Counterparty exposures are monitored daily and downgrades in credit
rating are reviewed on a timely basis. Credit risk arising from the
inability of a counterparty to meet the terms of our nancial instrument
contracts generally is limited to the amounts, if any, by which the
counterparty’s obligations exceed our obligations to the counterparty.
We have not incurred and do not expect to incur material credit
losses on our risk management or other nancial instruments.
Our policy is to manage interest cost using a mixture of xed-rate and
variable-rate debt. To manage this risk in a cost-efcient manner, we
enter into interest rate swaps in which we agree to exchange with
the counterparty, at specied intervals, the difference between xed
and variable interest amounts calculated by reference to an agreed-
upon notional principal amount.
Interest rate swaps that meet specic criteria under SFAS 133 are
accounted for as fair value and cash ow hedges. For fair value hedges,
the changes in the fair value of both the hedging instruments and the
underlying debt obligations are immediately recognized in interest
expense as equal and offsetting gains and losses. There were no fair
value hedging instruments at June 30, 2007. The fair value of fair value
hedging instruments was a liability of $32 at June 30, 2006. All fair
value hedges were 100% effective and as a result, there was no impact