Proctor and Gamble 2007 Annual Report Download - page 71
Download and view the complete annual report
Please find page 71 of the 2007 Proctor and Gamble annual report below. You can navigate through the pages in the report by either clicking on the pages listed below, or by using the keyword search tool below to find specific information within the annual report.-
 1
1 -
2
-
3
-
4
-
5
-
6
-
7
-
8
-
9
-
10
-
11
-
12
-
13
-
14
-
15
-
16
-
17
-
18
-
19
-
20
-
21
-
22
-
23
-
24
-
25
-
26
-
27
-
28
-
29
-
30
-
31
-
32
-
33
-
34
-
35
-
36
-
37
-
38
-
39
-
40
-
41
-
42
-
43
-
44
-
45
-
46
-
47
-
48
-
49
-
50
-
51
-
52
-
53
-
54
-
55
-
56
-
57
-
58
-
59
-
60
-
 61
61 -
 62
62 -
 63
63 -
 64
64 -
 65
65 -
 66
66 -
 67
67 -
 68
68 -
 69
69 -
 70
70 -
 71
71 -
 72
72 -
 73
73 -
 74
74 -
 75
75 -
 76
76 -
 77
77 -
 78
78
 |
 |

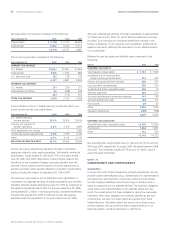
Millions of dollars except per share amounts or as otherwise specied.
Notes to Consolidated Financial Statements The Procter & Gamble Company 69
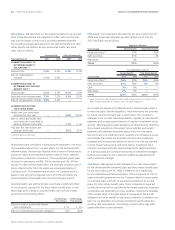
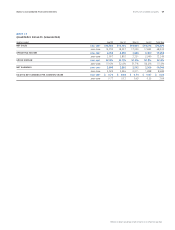
NOTE 13
Quarters ended Sept 30 Dec 31 Mar 31 Jun 30 Total Year
2005 – 2006 14,793 18,337 17,250 17,842 68,222
2005 – 2006 3,057 3,892 3,351 2,949 13,249
2005 – 2006 51.6% 52.4% 51.7% 50.2% 51.4%
2005 – 2006 2,029 2,546 2,211 1,898 8,684
2005 – 2006 0.77 0.72 0.63 0.55 2.64