Proctor and Gamble 2007 Annual Report Download - page 75
Download and view the complete annual report
Please find page 75 of the 2007 Proctor and Gamble annual report below. You can navigate through the pages in the report by either clicking on the pages listed below, or by using the keyword search tool below to find specific information within the annual report.-
 1
1 -
2
-
3
-
4
-
5
-
6
-
7
-
8
-
9
-
10
-
11
-
12
-
13
-
14
-
15
-
16
-
17
-
18
-
19
-
20
-
21
-
22
-
23
-
24
-
25
-
26
-
27
-
28
-
29
-
30
-
31
-
32
-
33
-
34
-
35
-
36
-
37
-
38
-
39
-
40
-
41
-
42
-
43
-
44
-
45
-
46
-
47
-
48
-
49
-
50
-
51
-
52
-
53
-
54
-
55
-
56
-
57
-
58
-
59
-
60
-
61
-
62
-
63
-
64
-
 65
65 -
 66
66 -
 67
67 -
 68
68 -
 69
69 -
 70
70 -
 71
71 -
 72
72 -
 73
73 -
 74
74 -
 75
75 -
 76
76 -
 77
77 -
 78
78
 |
 |
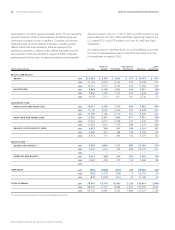
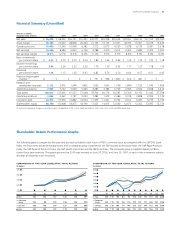
The Procter & Gamble Company
Amounts in millions,
except per share amounts 2006 2005 2004 2003 2002 2001 2000 1999 1998 1997
Net sales $ 68,222 $56,741 $51,407 $43,377 $40,238 $39,244 $39,951 $38,125 $37,154 $35,764
Gross margin 35,097 28,869 26,264 21,155 19,159 17,071 18,395 16,901 16,019 15,229
Operating income 13,249 10,469 9,382 7,312 6,073 4,260 5,678 6,130 5,581 5,318
Net earnings 8,684 6,923 6,156 4,788 3,910 2,612 3,363 3,683 3,472 3,305
Net earnings margin 12.7% 12.2% 12.0% 11.0% 9.7% 6.7% 8.4% 9.7% 9.3% 9.2%
Basic net earnings
per common share $ 2.79 $ 2.70 $ 2.34 $ 1.80 $ 1.46 $ 0.96 $ 1.24 $ 1.35 $ 1.25 $ 1.18
Diluted net earnings
per common share 2.64 2.53 2.20 1.70 1.39 0.92 1.17 1.27 1.18 1.10
Dividends
per common share 1.15 1.03 0.93 0.82 0.76 0.70 0.64 0.57 0.51 0.45
Restructuring program
charges (1)
$
—
$
—
$
—
$ 751 $ 958 $ 1,850 $ 814 $ 481 $
—
$
—
Research and
development expense 2,075 1,940 1,802 1,665 1,601 1,769 1,899 1,726 1,546 1,469
Advertising expense 7,122 5,929 5,466 4,487 3,782 3,729 3,906 3,542 3,638 3,414
Total assets 135,695 61,527 57,048 43,706 40,776 34,387 34,366 32,192 31,042 27,598
Capital expenditures 2,667 2,181 2,024 1,482 1,679 2,486 3,018 2,828 2,559 2,129
Long-term debt 35,976 12,887 12,554 11,475 11,201 9,792 9,012 6,265 5,774 4,159
Shareholders‘ equity 62,908 18,475 18,190 17,025 14,415 12,560 12,673 12,352 12,493 12,139
(1) Restructuring program charges, on an after-tax basis, totaled $538, $706, $1,475, $688 and $285 for 2003, 2002, 2001, 2000 and 1999, respectively.
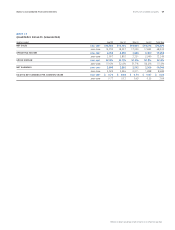
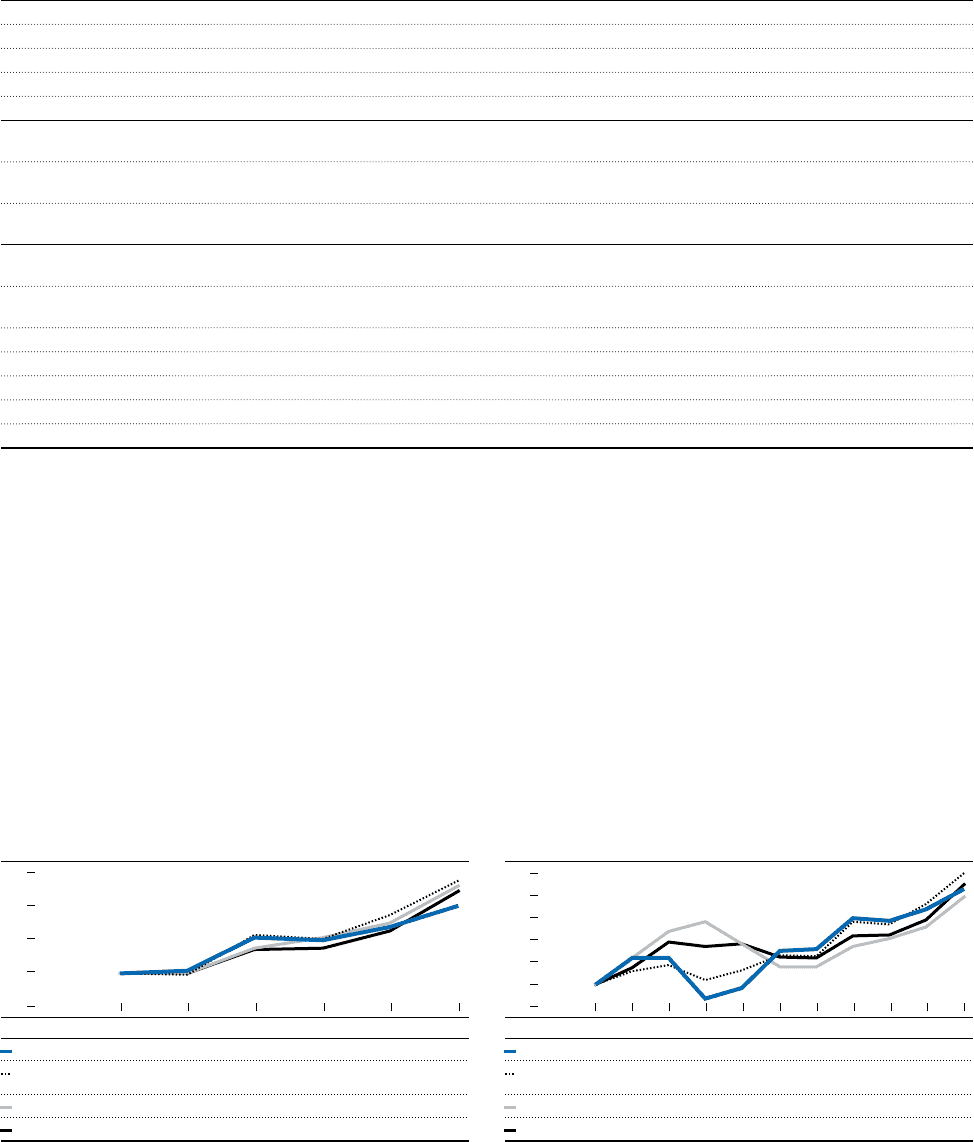
The following graphs compare the ve-year and ten-year cumulative total return of P&G’s common stock as compared with the S&P 500 Stock
Index, the Dow Jones Industrial Average Index, and a composite group comprised of the S&P Household Products Index, the S&P Paper Products
Index, the S&P Personal Products Index, the S&P Health Care Index and the S&P Food Index. The composite group is weighted based on P&G’s
current scal year revenues. The graphs assume that $100 was invested on June 30, 2002, and June 30, 1997, in each of the investment options
and that all dividends were reinvested.
8DBE6G>HDCD;;>K:"N:6G8JBJA6I>K:IDI6AG:IJGC
^cYdaaVgh
E&<
H&E*%%
9?>6
8dbedh^iZ
<gdje
É%,
&*&
&++
&+'
&,%
É%+
&(*
&(-
&('
&))
É%*
&'*
&',
&&.
&'+
É%)
&',
&&.
&&-
&'.
É%(
&%'
&%%
&%%
..
É%'
&%%
&%%
&%%
&%%
8DBE6G>HDCD;I:C"N:6G8JBJA6I>K:IDI6AG:IJGC
^cYdaaVgh
É%*É%( É%) É%,
É%+É%'É%&É%%É..É.-É.,
E&<'%-&-*&,'&,*&)%&(-.+-)&(%&(%&%%
H&E*%% &..&+*&*'&)(&'%&'%&)+&,&&+%&(%&%%
9?>6 '&(&,(&*+&**&(%&(&&)+&)(&)-&&.&%%
8dbedh^iZ
<gdje ''+&.&&+-&,&&('&((&&+&%*&''&&*&%%
,*
&,*
&%%
&'*
&*%
,*
&%%
&'*
&*%
&,*
'%%
''*
73