Safeway 1999 Annual Report Download - page 14
Download and view the complete annual report
Please find page 14 of the 1999 Safeway annual report below. You can navigate through the pages in the report by either clicking on the pages listed below, or by using the keyword search tool below to find specific information within the annual report.-
 1
1 -
2
-
3
-
 4
4 -
 5
5 -
 6
6 -
 7
7 -
 8
8 -
 9
9 -
 10
10 -
 11
11 -
 12
12 -
 13
13 -
 14
14 -
 15
15 -
 16
16 -
 17
17 -
 18
18 -
 19
19 -
 20
20 -
 21
21 -
 22
22 -
 23
23 -
 24
24 -
25
-
26
-
27
-
28
-
29
-
30
-
31
-
32
-
33
-
34
-
35
-
36
-
37
-
38
-
39
-
40
-
41
-
42
-
43
-
44
-
45
-
46
 |
 |

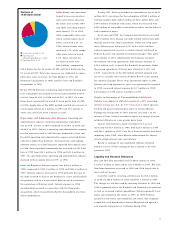
-60
-40
-20
95 96 97* 98 99*
56
48
35
28
30
0
20
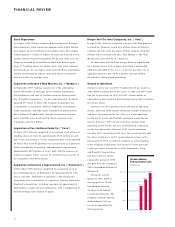
Our O&A expense margin improved
for the seventh consecutive year,
declining 30 basis points in 1999.
Improvement in Annual
Operating and Administrative
Expense Margin
(In basis points)
* Pro forma as defined on page 18
12
CONTROLLING EXPENSES
We made further improvements
in cost of goods sold by applying best
practices in product procurement,
distribution and category management.
We converted Carrs, and all remaining
Vons and Dominick’s applications,
to Safeway’s accounting and
merchandising systems.
We began consolidating corporate
administrative functions at Carrs
and Randall’s into Safeway’s
operations, and continued the
process at Dominick’s.
We negotiated competitive labor
agreements in several key markets.
Pro forma operating and administrative expense as a percentage of sales declined
again in 1999, continuing a seven-year trend. The ongoing improvement reflects
concerted efforts throughout the company to streamline support functions, simplify
work practices and maintain labor cost
parity. No other major food and drug
retailer has come close to Safeway in the
magnitude of expense reduction, meas-
ured as a percentage of sales, since 1992.