Safeway 1999 Annual Report Download - page 34
Download and view the complete annual report
Please find page 34 of the 1999 Safeway annual report below. You can navigate through the pages in the report by either clicking on the pages listed below, or by using the keyword search tool below to find specific information within the annual report.-
 1
1 -
2
-
3
-
4
-
5
-
6
-
7
-
8
-
9
-
10
-
11
-
12
-
13
-
14
-
15
-
16
-
17
-
18
-
19
-
20
-
21
-
22
-
23
-
 24
24 -
 25
25 -
 26
26 -
 27
27 -
 28
28 -
 29
29 -
 30
30 -
 31
31 -
 32
32 -
 33
33 -
 34
34 -
 35
35 -
 36
36 -
 37
37 -
 38
38 -
 39
39 -
 40
40 -
 41
41 -
 42
42 -
 43
43 -
 44
44 -
45
-
46
 |
 |

32
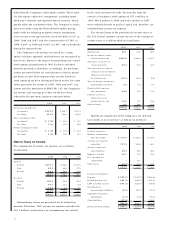
The following schedule shows the composition of total
rental expense for all operating leases (in millions). In gen-
eral, contingent rentals are based on individual store sales.
1999 1998 1997
Property leases:
Minimum rentals $ 2 80 .3 $208.7 $206.0
Contingent rentals 18.6 19.2 12.3
Less rentals from subleases (13 .2) (12.0) (13.4)
■■■■■■■■■■ ■■■■■■■■■■■
285.7 215.9 204.9
Equipment leases 42 .9 22.4 19.3
■■■■■■■■■■ ■■■■■■■■■■■
$ 32 8.6 $238.3 $224.2
■■■■■■■■■■ ■■■■■■■■■■■
Note E: Interest Expense
Interest expense consisted of the following (in millions):
1999 1998 1997
Bank credit agreement $ 19.4 $ 10.8 $ 36.9
Commercial paper 87 .4 83.7 43.8
9.30% Senior Secured Debentures 2.3 2.3 5.3
6.85% Senior Notes 13.7 13.7 4.1
7.00% Senior Notes 17.5 17.5 5.2
7.45% Senior Debentures 1 1.2 11.2 3.4
5.75% Senior Notes 23.0 3.5 –
5.875% Senior Notes 23 .5 3.6 –
6.05% Senior Notes 21.2 3.2 –
6.50% Senior Notes 16.3 2.5 –
7.00% Senior Notes 12.8 ––
7.25% Senior Notes 8.8 ––
7.5% Senior Notes 11.4 ––
9.35% Senior Subordinated Notes 1.3 6.2 12.3
10% Senior Subordinated Notes 8.0 8.0 19.3
9.65% Senior Subordinated
Debentures 7.8 7.8 17.8
9.875% Senior Subordinated
Debentures 2.4 2.4 8.2
10% Senior Notes 0.6 0.6 4.3
Vons Debentures ––10.2
Mortgage notes payable 7.3 12.1 22.0
Other notes payable 16.0 9.5 9.9
Medium-term notes 2 .1 2.1 4.4
Short-term bank borrowings 4.9 10.6 8.8
Obligations under capital leases 46.1 27.8 26.0
Amortization of deferred
finance costs 4.8 1.6 1.7
Interest rate swap and
cap agreements 1.7 2.8 3.3
Capitalized interest (9.3 ) (8.5) (5.7)
■■■■■■■■■■ ■■■■■■■■■■■
$ 36 2.2 $ 235.0 $ 241.2
■■■■■■■■■■ ■■■■■■■■■■■
As of year-end 1999, the Company had effectively con-
verted $200.0 million of its floating rate debt to fixed inter-
est rate debt through interest rate swap agreements. Under
one swap agreement, Safeway pays interest of 6.2% on
the $100.0 million notional amount and receives a variable
interest rate based on Federal Reserve rates quoted for com-
mercial paper. This agreement expires in 2007.
Additionally, the Company assumed two interest rate swap
agreements, with notional amounts of $50.0 million each,
as part of the Randall’s Acquisition. Under these swap
agreements, Safeway pays interest of 5.30% and 5.49%,
respectively, on the $50 million notional amounts and
receives a variable rate based on Federal Reserve rates
quoted for commercial paper. These swap agreements
expire in 2001. Interest rate swap agreements, and a cap
agreement that expired in 1999, increased interest expense
by $1.7 million in 1999, $2.8 million in 1998 and $3.3 mil-
lion in 1997. At year-end 1999, the net unrealized gain on
interest rate swap agreements was $4.7 million compared
to an unrealized loss of $7.0 million at year-end 1998.
The Company is not subject to credit risk because the
notional amounts do not represent cash flows. The Company
is subject to risk from nonperformance of the counterparties
to the swap agreements in the amount of any interest differ-
ential to be received. Because the Company monitors the
credit ratings of its counterparties, which are limited to
major financial institutions, Safeway does not anticipate
nonperformance by the counterparties.
Because the Company intends to hold these agreements as
hedges for the term of the agreements, the market risk associ-
ated with changes in interest rates should not be significant.
Note F: Capital Stock
Shares Authorized and Issued Authorized preferred
stock consists of 25 million shares of which none was
outstanding during 1999, 1998 or 1997. Authorized
common stock consists of 1.5 billion shares at $0.01 par
value. Common stock outstanding at year-end 1999 was
493.6 million shares (net of 65.4 million shares of treasury
stock) and 490.3 million shares at year-end 1998 (net of
60.6 million shares of treasury stock).
Stock Option Plans Under Safeway’s stock option
plans, the Company may grant incentive and non-qualified
options to purchase common stock at an exercise price
equal to or greater than the fair market value at the grant
date, as determined by the Compensation and Stock
Option Committee of the Board of Directors. Options gen-
erally vest over seven years. Vested options are exercis-
able in part or in full at any time prior to the expiration
date of 10 to 15 years from the date of the grant. Options
to purchase 16.9 million shares were available for grant at
year-end 1999.