Safeway 1999 Annual Report Download - page 27
Download and view the complete annual report
Please find page 27 of the 1999 Safeway annual report below. You can navigate through the pages in the report by either clicking on the pages listed below, or by using the keyword search tool below to find specific information within the annual report.-
 1
1 -
2
-
3
-
4
-
5
-
6
-
7
-
8
-
9
-
10
-
11
-
12
-
13
-
14
-
15
-
16
-
 17
17 -
 18
18 -
 19
19 -
 20
20 -
 21
21 -
 22
22 -
 23
23 -
 24
24 -
 25
25 -
 26
26 -
 27
27 -
 28
28 -
 29
29 -
 30
30 -
 31
31 -
 32
32 -
 33
33 -
 34
34 -
 35
35 -
 36
36 -
 37
37 -
38
-
39
-
40
-
41
-
42
-
43
-
44
-
45
-
46
 |
 |

25
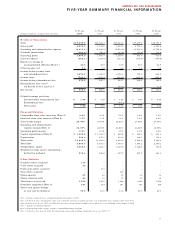
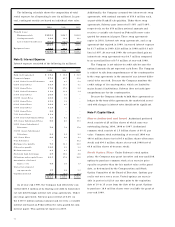
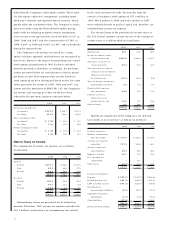
Cash Flow from Financing Activities:
Additions to short-term borrowings $ 204.9 $ 251.7 $ 414.5
Payments on short-term borrowings (237.0) (299.9) (287.5)
Additions to long-term borrowings 3,840.7 2,722.3 4,254.3
Payments on long-term borrowings (2,520.0) (1,789.9) (3,553.5)
Purchase of treasury stock (651.0) –(1,376.0)
Net proceeds from exercise of warrants and stock options 22.9 34.5 43.9
Premiums paid on early retirement of debt ––(97.7)
Other (24.5) (15.3) (12.6)
■■■■■■■■■■■■■■■■■■■■■■ ■■■■■■■■■■■■■■■■■■■■■
Net cash flow from (used by) financing activities 636.0 903.4 (614.6)
■■■■■■■■■■■■■■■■■■■■■■ ■■■■■■■■■■■■■■■■■■■■■
Effect of changes in exchange rates on cash 0.4 (1.2) (1.8)
■■■■■■■■■■■■■■■■■■■■■■ ■■■■■■■■■■■■■■■■■■■■■
Increase (decrease) in cash and equivalents 60.5 (31.5) (2.5)
Cash and Equivalents:
Beginning of year 45.7 77.2 79.7
■■■■■■■■■■■■■■■■■■■■■■ ■■■■■■■■■■■■■■■■■■■■■
End of year $ 106.2 $ 45.7 $ 77.2
■■■■■■■■■■■■■■■■■■■■■■ ■■■■■■■■■■■■■■■■■■■■■
Other Cash Flow Information:
Cash payments during the year for:
Interest $ 351.4 $ 241.0 $ 263.6
Income taxes, net of refunds 378.2 468.7 214.6
Noncash Investing and Financing Activities:
Stock issued for acquisition of Randall’s Food Markets, Inc. 546.4 ––
Stock issued for acquisition of The Vons Companies, Inc. ––1,693.0
Tax benefit from stock options exercised 77.0 85.2 42.4
Capital lease obligations entered into 24.8 34.2 37.3
Mortgage notes assumed in property additions 9.7 32.8 0.9
See accompanying notes to consolidated financial statements.
52 Weeks 52 Weeks 53 Weeks
(In millions) 1999 1998 1997