Safeway 1999 Annual Report Download - page 4
Download and view the complete annual report
Please find page 4 of the 1999 Safeway annual report below. You can navigate through the pages in the report by either clicking on the pages listed below, or by using the keyword search tool below to find specific information within the annual report.-
 1
1 -
 2
2 -
 3
3 -
 4
4 -
 5
5 -
 6
6 -
 7
7 -
 8
8 -
 9
9 -
 10
10 -
 11
11 -
 12
12 -
 13
13 -
 14
14 -
 15
15 -
16
-
17
-
18
-
19
-
20
-
21
-
22
-
23
-
24
-
25
-
26
-
27
-
28
-
29
-
30
-
31
-
32
-
33
-
34
-
35
-
36
-
37
-
38
-
39
-
40
-
41
-
42
-
43
-
44
-
45
-
46
 |
 |

2
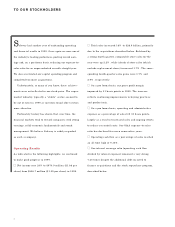
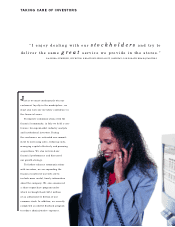
TO OUR STOCKHOLDERS
Safeway had another year of outstanding operating
and financial results in 1999. Once again we were one of
the industry’s leading performers, posting record earn-
ings and, on a pro forma basis, reducing our expense-to-
sales ratio for an unprecedented seventh straight year.
We also accelerated our capital spending program and
completed two more acquisitions.
Unfortunately, as many of you know, these achieve-
ments were not reflected in our stock price. The super-
market industry, typically a “stable” sector, seemed to
be out of favor in 1999 as investors found other sectors
more attractive.
Fortunately history has shown that, over time, the
financial markets tend to reward companies with strong
earnings, solid economic fundamentals and sound
management. We believe Safeway is widely regarded
as such a company.
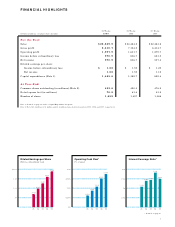
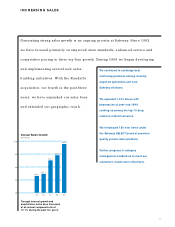
Operating Results
As indicated in the following highlights, we continued
to make good progress in 1999.
■■Net income rose 20% to $970.9 million ($1.88 per
share) from $806.7 million ($1.59 per share) in 1998.
■■Total sales increased 18% to $28.9 billion, primarily
due to the acquisitions described below. Bolstered by
a strong fourth quarter, comparable-store sales for the
year were up 2.2% , while identical-store sales (which
exclude replacement stores) increased 1.7% . The corre-
sponding fourth-quarter sales gains were 3.7% and
2.9% , respectively.
■■On a pro forma basis, our gross profit margin
improved by 51 basis points in 1999. The increase
reflects continuing improvements in buying practices
and product mix.
■■On a pro forma basis, operating and administrative
expense as a percentage of sales fell 30 basis points,
largely as a result of increased sales and ongoing efforts
to reduce or control costs. Our O&A expense-to-sales
ratio has declined for seven consecutive years.
■■Operating cash flow as a percentage of sales reached
an all-time high of 9.35%.
■■Our interest coverage ratio (operating cash flow
divided by interest expense) remained a very strong
7.45 times despite the additional debt incurred to
finance acquisitions and the stock repurchase program,
described below.