Safeway 1999 Annual Report Download - page 21
Download and view the complete annual report
Please find page 21 of the 1999 Safeway annual report below. You can navigate through the pages in the report by either clicking on the pages listed below, or by using the keyword search tool below to find specific information within the annual report.-
 1
1 -
2
-
3
-
4
-
5
-
6
-
7
-
8
-
9
-
10
-
 11
11 -
 12
12 -
 13
13 -
 14
14 -
 15
15 -
 16
16 -
 17
17 -
 18
18 -
 19
19 -
 20
20 -
 21
21 -
 22
22 -
 23
23 -
 24
24 -
 25
25 -
 26
26 -
 27
27 -
 28
28 -
 29
29 -
 30
30 -
 31
31 -
32
-
33
-
34
-
35
-
36
-
37
-
38
-
39
-
40
-
41
-
42
-
43
-
44
-
45
-
46
 |
 |

19
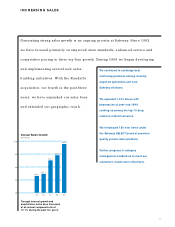
Sales Strong store operations
helped to increase identical-
store sales (stores operating
the entire year in both 1999
and 1998, excluding replace-
ment stores) 1.7% in 1999,
while comparable-store sales,
which include replacement
stores, increased 2.2% . In
1998, identical-store sales
increased 3.7% while compa-
rable-store sales increased
4.1% . Total sales for the
52 weeks of 1999 were
$28.9 billion, compared to
$24.5 billion for the 52 weeks of 1998 and $22.5 billion for the
53 weeks of 1997. Total sales increases are attributed to compa-
rable-store sales increases, the Vons Merger in 1997, the
Dominick’s Acquisition in 1998, and the Carrs and Randall’s
Acquisitions in 1999.
Gross Profit Safeway’s continuing improvement in buying prac-
tices and product mix helped to increase gross profit to 29.49%
of sales, from 29.10% in 1998 and 28.53% in 1997. On a pro
forma basis, gross profit increased 51 basis points from 28.98%
in 1998. Application of the LIFO method resulted in increases in
cost of goods sold of $1.2 million in 1999 and $7.1 million in
1998, and a decrease of $6.1 million in 1997.
Operating and Administrative Expense Operating and
administrative expense, including amortization of goodwill,
was 22.57% of sales in 1999 compared to 22.56% in 1998 and
22.84% in 1997. Safeway’s operating and administrative expense-
to-sales ratio increased in 1999 because Dominick’s, Carrs and
Randall’s operating and administrative expense ratio had histori-
cally been higher than Safeway’s. Increased sales and ongoing
efforts to reduce or control expenses improved this expense ratio
in 1998. Annual goodwill amortization has increased to $101.4 mil-
lion in 1999 from $56.3 million in 1998 and $41.8 million in
1997. On a pro forma basis, operating and administrative expense
declined 30 basis points from 22.87% in 1998.
Interest Expense Interest expense was $362.2 million in
1999, compared to $235.0 million in 1998 and $241.2 million in
1997. Interest expense increased in 1999 primarily because of
the debt incurred to finance the Dominick’s, Carrs and Randall’s
Acquisitions and, to a lesser extent, debt incurred to refinance
the repurchase of Safeway stock. Interest expense in 1998
included debt incurred in connection with the Dominick’s
Acquisition, which was partially offset by the paydown of certain
other indebtedness.
During 1997, Safeway recorded an extraordinary loss of $64.1
million ($0.13 per share) for the redemption of $589.0 million of
Safeway’s public debt, $285.5 million of Vons’ public debt, and
$40.0 million of medium-term notes, which was financed with
$600 million of new public senior debt securities and the balance
with commercial paper.
As of year-end 1999, the Company had effectively converted
$200.0 million of its floating rate debt to fixed interest rate debt
through interest rate swaps agreements. Under one swap agree-
ment, Safeway pays interest of 6.2% on the $100.0 million
notional amount and receives a variable interest rate based on
Federal Reserve rates quoted for commercial paper. This agree-
ment expires in 2007. Additionally, the Company assumed
two interest rate swap agreements, with notional amounts of
$50.0 million each, as part of the Randall’s Acquisition. Under
these swap agreements, Safeway pays interest of 5.30% and
5.49%, respectively, on the $50 million notional amounts and
receives a variable rate based on Federal Reserve rates quoted
for commercial paper. These swap agreements expire in 2001.
Interest rate swap agreements, and a cap agreement that expired
in 1999, increased interest expense by $1.7 million in 1999,
$2.8 million in 1998 and $3.3 million in 1997.
Equity in Earnings of Unconsolidated Affiliates
Safeway’s investment in affiliates consists of a 49% ownership
interest in Casa Ley, S.A. de C.V. (“Casa Ley”), which operates
86 food and general merchandise stores in western Mexico.
Through the first quarter of 1997, Safeway also held a 34.4%
interest in Vons. Safeway records its equity in earnings of uncon-
solidated affiliates on a one-quarter delay basis.
Income from Safeway’s equity investment in Casa Ley
increased to $34.5 million in 1999, from $28.5 million in 1998
and $22.7 million in 1997. Casa Ley’s financial results have been
improving since 1995, when Mexico suffered from the adverse
effects of high interest rates and inflation.
Equity in earnings of unconsolidated affiliates included
Safeway’s share of Vons earnings of $12.2 million in the first
quarter of 1997.
Liquidity and Financial Resources
Net cash flow from operations was $1,488.4 million in 1999,
$1,252.7 million in 1998 and $1,221.6 million in 1997. Net cash
flow from operations increased in 1999 and 1998 largely due to
increased net income.
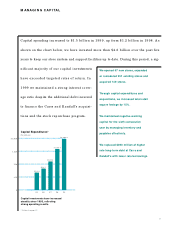
Cash flow used by investing activities was $2,064.3 million
in 1999, $2,186.4 million in 1998 and $607.7 million in 1997.
The change in cash flow used by investing activities in 1999 and
1998 is primarily due to the Randall’s and Dominick’s Acquisitions
as well as increased capital expenditures. Safeway opened 67 new
stores and remodeled 251 stores in 1999. In 1998, Safeway
opened 46 new stores and remodeled 234 stores. The Company
completed a new distribution center in Maryland and opened a
new manufacturing plant in California during 1998.
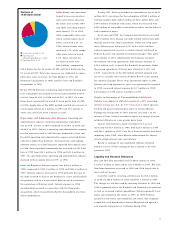
Portions of
1999 Sales Dollar
■ Costs of Goods Sold: 70.5%
■ Operating and
Administrating Expense: 22.6%
■ Operating Profit: 6.9%