Safeway 1999 Annual Report Download - page 15
Download and view the complete annual report
Please find page 15 of the 1999 Safeway annual report below. You can navigate through the pages in the report by either clicking on the pages listed below, or by using the keyword search tool below to find specific information within the annual report.-
 1
1 -
2
-
3
-
4
-
 5
5 -
 6
6 -
 7
7 -
 8
8 -
 9
9 -
 10
10 -
 11
11 -
 12
12 -
 13
13 -
 14
14 -
 15
15 -
 16
16 -
 17
17 -
 18
18 -
 19
19 -
 20
20 -
 21
21 -
 22
22 -
 23
23 -
 24
24 -
 25
25 -
26
-
27
-
28
-
29
-
30
-
31
-
32
-
33
-
34
-
35
-
36
-
37
-
38
-
39
-
40
-
41
-
42
-
43
-
44
-
45
-
46
 |
 |
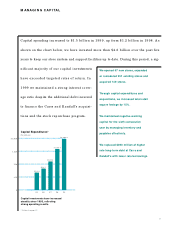
0
375
750
99
95 96 97 98
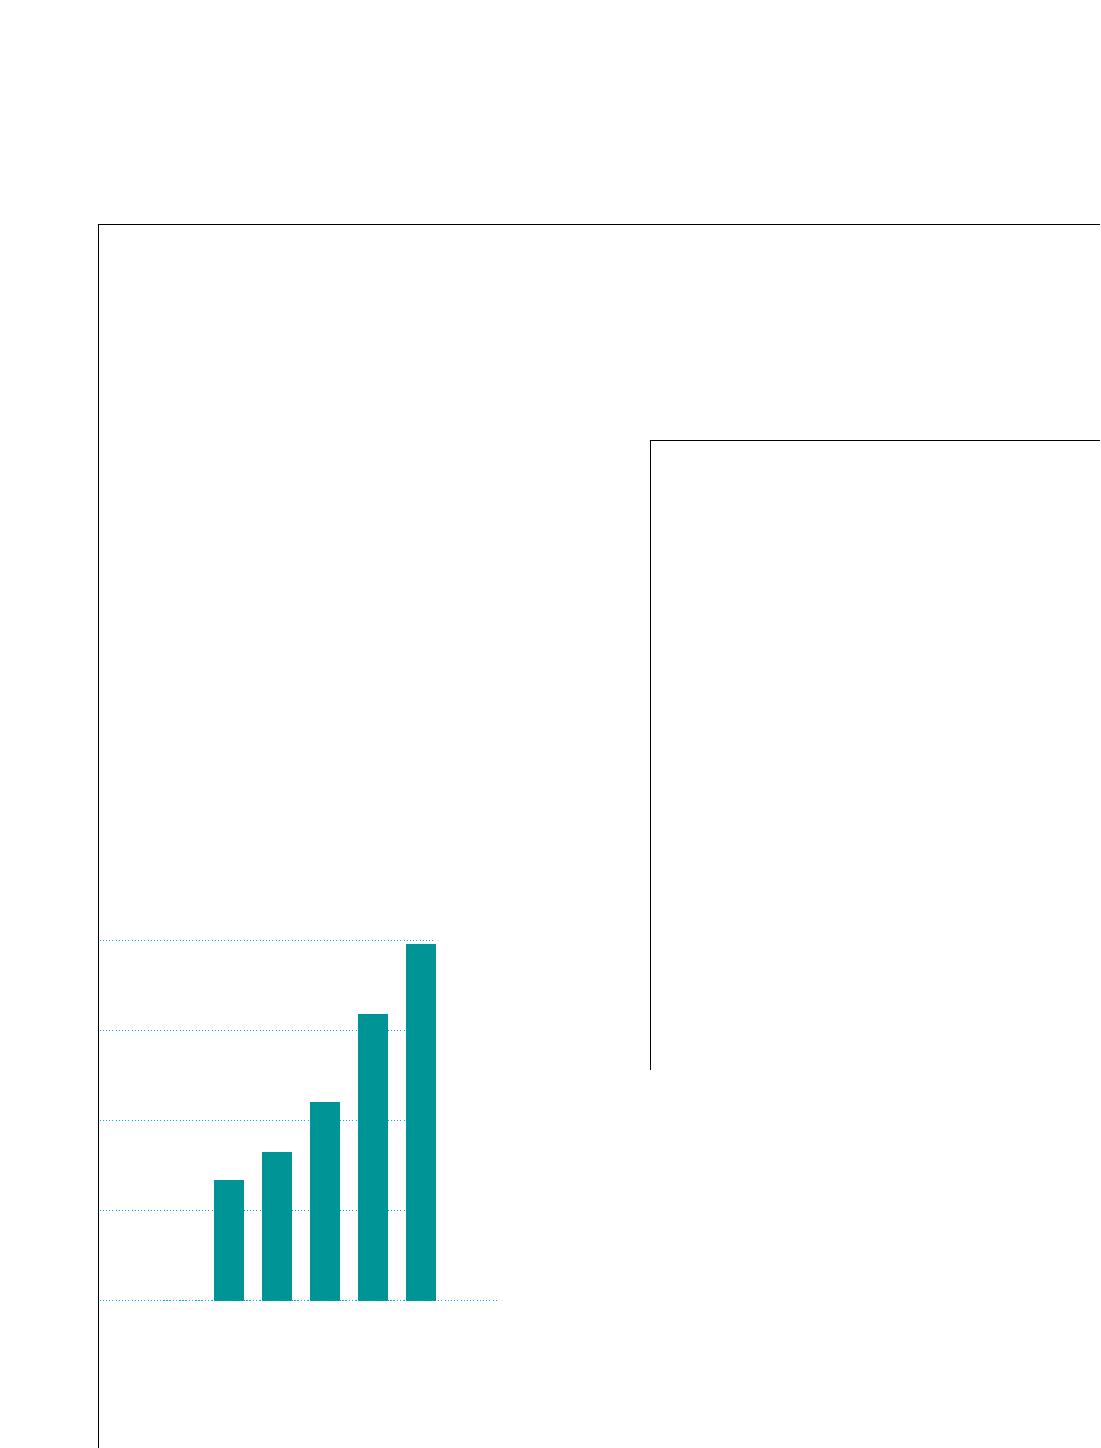
$503.2
$620.3
$829.4
$1,189.7
$1,485.6
1,125
$1,500
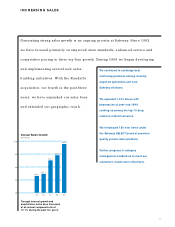
Capital investments have increased
steadily since 1993, reflecting
strong operating results.
Capital Expenditures*
(In millions)
* Defined on page 15
MANAGING CAPITAL
13
We opened 67 new stores, expanded
or remodeled 251 existing stores and
acquired 149 stores.
Through capital expenditures and
acquisitions, we increased total retail
square footage by 15%.
We maintained negative working
capital for the sixth consecutive
year by managing inventory and
payables effectively.
We replaced $290 million of higher
rate long-term debt at Carrs and
Randall’s with lower rate borrowings.
Capital spending increased to $1.5 billion in 1999, up from $1.2 billion in 1998. As
shown on the chart below, we have invested more than $4.6 billion over the past five
years to keep our store system and support facilities up to date. During this period, a sig-
nificant majority of our capital investments
have exceeded targeted rates of return. In
1999 we maintained a strong interest cover-
age ratio despite the additional debt incurred
to finance the Carrs and Randall’s acquisi-
tions and the stock repurchase program.