Safeway 1999 Annual Report Download - page 36
Download and view the complete annual report
Please find page 36 of the 1999 Safeway annual report below. You can navigate through the pages in the report by either clicking on the pages listed below, or by using the keyword search tool below to find specific information within the annual report.-
 1
1 -
2
-
3
-
4
-
5
-
6
-
7
-
8
-
9
-
10
-
11
-
12
-
13
-
14
-
15
-
16
-
17
-
18
-
19
-
20
-
21
-
22
-
23
-
24
-
25
-
 26
26 -
 27
27 -
 28
28 -
 29
29 -
 30
30 -
 31
31 -
 32
32 -
 33
33 -
 34
34 -
 35
35 -
 36
36 -
 37
37 -
 38
38 -
 39
39 -
 40
40 -
 41
41 -
 42
42 -
 43
43 -
 44
44 -
 45
45 -
 46
46
 |
 |

34
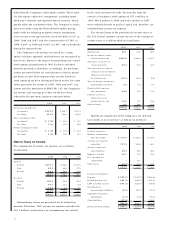
differ from the Company’s stock option awards. These mod-
els also require subjective assumptions, including future
stock price volatility and expected time to exercise, which
greatly affect the calculated values. The Company’s calcula-
tions were made using the Black-Scholes option pricing
model with the following weighted average assumptions:
seven to nine years expected life; stock volatility of 31% in
1999, 1998 and 1997; risk-free interest rates of 5.79% in
1999, 5.26% in 1998 and 6.29% in 1997; and no dividends
during the expected term.
The Company’s calculations are based on a single
option valuation approach and forfeitures are recognized as
they occur. However, the impact of outstanding non-vested
stock options granted prior to 1995 has been excluded
from the pro forma calculation; accordingly, the pro forma
results presented below are not indicative of future period
pro forma results. Had compensation cost for Safeway’s
stock option plans been determined based on the fair value
at the grant date for awards in 1999, 1998 and 1997, con-
sistent with the provisions of SFAS No. 123, the Company’s
net income and earnings per share would have been
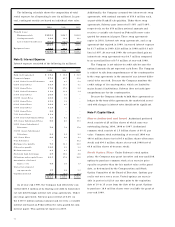
reduced to the pro forma amounts indicated below:
1999 1998 1997
Net income (in millions):
As reported $ 970.9 $ 806.7 $557.4
Pro forma 951.5 794.8 553.5
Basic earnings per share:
As reported $ 1.9 5 $ 1.67 $ 1.21
Pro forma 1.91 1.65 1.20
Diluted earnings per share:
As reported $ 1.8 8 $ 1.59 $ 1.12
Pro forma 1.85 1.56 1.11
Note G: Taxes on Income
The components of income tax expense are as follows
(in millions):
1999 1998 1997
Current:
Federal $333.7 $398.8 $ 303.6
State 62.3 80.0 57.5
Foreign 62.4 52.0 37.8
■■■■■■■■■■ ■■■■■■■■■■
458.4 530.8 398.9
■■■■■■■■■■ ■■■■■■■■■■
Deferred:
Federal 188.9 44.4 40.4
State 38.1 12.2 8.4
Foreign 17.7 2.8 7.1
■■■■■■■■■■ ■■■■■■■■■■
244.7 59.4 55.9
■■■■■■■■■■ ■■■■■■■■■■
$703.1 $590.2 $ 454.8
■■■■■■■■■■ ■■■■■■■■■■
Extraordinary losses are presented net of related tax
benefits. Therefore, 1997 income tax expense excludes the
$41.1 million tax benefit on an extraordinary loss related
to the early retirement of debt. Tax benefits from the
exercise of employee stock options of $77.0 million in
1999, $85.2 million in 1998 and $42.4 million in 1997
were credited directly to paid-in capital and, therefore, are
excluded from income tax expense.
The reconciliation of the provision for income taxes at
the U.S. federal statutory income tax rate to the Company’s
income taxes is as follows (dollars in millions):
199 9 1998 1997
Statutory rate 35% 35% 35%
Income tax expense using
federal statutory rate $585.9 $ 488.9 $ 376.7
State taxes on income net
of federal benefit 65 .2 59.9 42.8
Taxes provided on equity in
earnings of unconsolidated
affiliates at rates below
the statutory rate (12.1) (10.0) (9.4)
Taxes on foreign earnings not
permanently reinvested 8.3 7.9 8.9
Nondeductible expenses
and amortization 32 .9 17.6 13.6
Difference between
statutory rate and
foreign effective rate 16.6 11.1 10.6
Other accruals 6.3 14.8 11.6
■■■■■■■■■■ ■■■■■■■■■■
$7 03.1 $ 590.2 $ 454.8
■■■■■■■■■■ ■■■■■■■■■■
Significant components of the Company’s net deferred
tax liability at year-end were as follows (in millions):
199 9 1998 1997
Deferred tax assets:
Workers’ compensation
and other claims $ 144.7 $ 158.5 $ 138.8
Accruals not currently
deductible 111.3 106.6 80.3
Accrued claims and
other liabilities 28.9 48.0 48.8
Employee benefits 46 .1 34.7 18.4
U.S. operating loss
carryforward –12.1 –
Other assets 42 .7 51.5 14.6
■■■■■■■■■■ ■■■■■■■■■■
$ 37 3.7 $ 411.4 $ 300.9
■■■■■■■■■■ ■■■■■■■■■■
Deferred tax liabilities:
Property $ (38 7.8) $ (315.7) $(280.8)
Prepaid pension costs (165 .4) (166.4) (161.3)
LIFO inventory reserves (171.3 ) (125.7) (106.0)
Investments in
unconsolidated affiliates (5.8) (16.7) (15.3)
Cumulative translation
adjustments (4.9) (3.8) (16.2)
Other liabilities (17.6) –(18.3)
■■■■■■■■■■ ■■■■■■■■■■
(752.8) (628.3) (597.9)
■■■■■■■■■■ ■■■■■■■■■■
Net deferred tax liability $ (379.1) $(216.9) $(297.0)
■■■■■■■■■■ ■■■■■■■■■■