Safeway 2009 Annual Report Download - page 41
Download and view the complete annual report
Please find page 41 of the 2009 Safeway annual report below. You can navigate through the pages in the report by either clicking on the pages listed below, or by using the keyword search tool below to find specific information within the annual report.-
 1
1 -
2
-
3
-
4
-
5
-
6
-
7
-
8
-
9
-
10
-
11
-
12
-
13
-
14
-
15
-
16
-
17
-
18
-
19
-
20
-
21
-
22
-
23
-
24
-
25
-
26
-
27
-
28
-
29
-
30
-
 31
31 -
 32
32 -
 33
33 -
 34
34 -
 35
35 -
 36
36 -
 37
37 -
 38
38 -
 39
39 -
 40
40 -
 41
41 -
 42
42 -
 43
43 -
 44
44 -
 45
45 -
 46
46 -
 47
47 -
 48
48 -
 49
49 -
 50
50 -
 51
51 -
52
-
53
-
54
-
55
-
56
-
57
-
58
-
59
-
60
-
61
-
62
-
63
-
64
-
65
-
66
-
67
-
68
-
69
-
70
-
71
-
72
-
73
-
74
-
75
-
76
-
77
-
78
-
79
-
80
-
81
-
82
-
83
-
84
-
85
-
86
-
87
-
88
-
89
-
90
-
91
-
92
-
93
-
94
-
95
-
96
-
97
-
98
-
99
-
100
-
101
-
102
 |
 |
SAFEWAY INC. AND SUBSIDIARIES
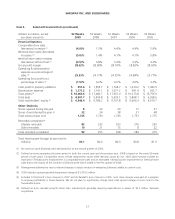
investments in everyday prices and higher advertising expense, partly offset by lower LIFO expense, higher gift card
revenue and higher energy costs. LIFO income was $35.2 million in 2009 compared to expense of $34.9 million in 2008.
The gross profit margin declined 36 basis points to 28.38% of sales in 2008 from 28.74% of sales in 2007. Excluding
fuel, gross profit declined 25 basis points primarily because of investments in price and higher LIFO expense, partly offset
by lower advertising expense and improved inventory shrink. LIFO expense was $34.9 million in 2008 compared to $13.9
million in 2007.
The decline in advertising expense in 2008 was primarily the result of a more efficient mix of advertising media. Improved
inventory shrink is the result of long-term efforts.
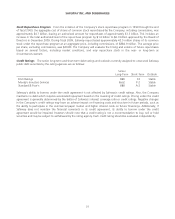
Operating and Administrative Expense Operating and administrative expense consists primarily of store occupancy
costs and backstage expenses, which, in turn, consist primarily of wages, employee benefits, rent, depreciation and
utilities.
Operating and administrative expense was 25.33% of sales in 2009 compared to 24.17% of sales in 2008 and 24.55%
in 2007.
Operating and administrative expense margin increased 116 basis points to 25.33% of sales in 2009 from 24.17% of
sales in 2008. Lower fuel sales in 2009 increased operating and administrative expense margin 56 basis points. The
remaining 60 basis points was primarily the result of decreased sales leverage, increased charges from property
impairments and retirements and increased pension expense, partly offset by lower workers’ compensation expense and
energy costs.
Operating and administrative expense improved 38 basis points to 24.17% of sales in 2008 from 24.55% of sales in
2007. Higher fuel sales in 2008 improved operating and administrative expense by 11 basis points. The remaining 27
basis point improvement is primarily due to reduced employee costs as a percentage of sales partly offset by higher
energy costs, currency exchange losses and workers’ compensation costs.
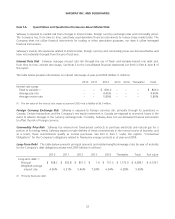
(Loss) Gains on Property Retirements Operating and administrative expense included a net loss on property retirements
of $12.7 million in 2009, a gain of $19.0 million in 2008 and a gain of $42.3 million in 2007. In 2007, the Company sold
a Bellevue, Washington distribution center at a gain of $46.6 million and a warehouse in Chicago, Illinois at a gain of
$11.2 million. These gains were partly offset by net losses on other property retirements.
Interest Expense Interest expense was $331.7 million in 2009, compared to $358.7 million in 2008 and $388.9 million
in 2007. Interest expense decreased in 2009 and 2008 primarily due to a combination of lower average borrowings and a
lower average interest rate.
Other Income Other income consists of interest income and equity in earnings (losses) from Safeway’s unconsolidated
affiliate. Interest income was $2.3 million in 2009, $12.5 million in 2008 and $11.8 million in 2007. Equity in earnings
(losses) of unconsolidated affiliate was income of $8.5 million in 2009, a loss of $2.5 million in 2008 and income of $8.7
million in 2007.
Income Taxes In 2009, Safeway had income tax expense of $144.2 million despite having a pre-tax loss of $953.3
million. The 2009 tax expense reflects the tax effect of the goodwill impairment charge which is largely nondeductible for
income tax purposes and, therefore, increases the Company’s effective income tax rate. The impact of the goodwill
impairment charge on the tax expense was partly offset by a benefit of $74.9 million from the favorable resolution of
various tax matters. The effective tax rates for 2008 and 2007 were 35.8% and 36.7%, respectively.
23