Safeway 2009 Annual Report Download - page 5
Download and view the complete annual report
Please find page 5 of the 2009 Safeway annual report below. You can navigate through the pages in the report by either clicking on the pages listed below, or by using the keyword search tool below to find specific information within the annual report.-
 1
1 -
 2
2 -
 3
3 -
 4
4 -
 5
5 -
 6
6 -
 7
7 -
 8
8 -
 9
9 -
 10
10 -
 11
11 -
 12
12 -
 13
13 -
 14
14 -
 15
15 -
 16
16 -
17
-
18
-
19
-
20
-
21
-
22
-
23
-
24
-
25
-
26
-
27
-
28
-
29
-
30
-
31
-
32
-
33
-
34
-
35
-
36
-
37
-
38
-
39
-
40
-
41
-
42
-
43
-
44
-
45
-
46
-
47
-
48
-
49
-
50
-
51
-
52
-
53
-
54
-
55
-
56
-
57
-
58
-
59
-
60
-
61
-
62
-
63
-
64
-
65
-
66
-
67
-
68
-
69
-
70
-
71
-
72
-
73
-
74
-
75
-
76
-
77
-
78
-
79
-
80
-
81
-
82
-
83
-
84
-
85
-
86
-
87
-
88
-
89
-
90
-
91
-
92
-
93
-
94
-
95
-
96
-
97
-
98
-
99
-
100
-
101
-
102
 |
 |

P A G E T H R E E
S A F E W A Y I N C . • • 2 0 0 9 A N N U A L R E P O R T
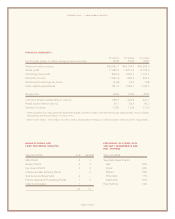
F I N A N C I A L H I GH L I G H T S
For the year (dollars in millions, except per-share amounts)
52 weeks
20091
53 weeks
2008
52 weeks
2007
Sales and other revenue $ 40,850.7 $ 44,104.0 $ 42,286.0
Gross profit 11,693.5 12,514.8 12,152.9
Operating (loss) profit (628.7) 1,852.7 1,772.1
Net (loss) income (1,097.5) 965.3 888.4
Diluted (loss) earnings per share (2.66) 2.21 1.99
Cash capital expenditures 851.6 1,595.7 1,768.7
At year-end 2009 2008 2007
Common shares outstanding (in millions)2388.3 428.9 440.1
Retail square feet (in millions) 80.1 80.4 80.3
Number of stores 1,725 1,739 1,743
1 2009 includes a non-cash goodwill impairment charge of $1,818.2 million, net of tax ($4.40 per diluted share). A reconciliation
table follows the Annual Report on Form 10-K.
2 Net of 204.3 million, 161.8 million and 149.2 million shares held in treasury at year-end 2009, 2008 and 2007, respectively.
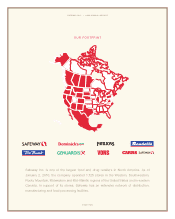
M A N U FA C T U R I N G AND
FO O D P R O CE SS I N G F AC I L I T I E S
Year-end 2009 U.S. Canada
Milk Plants 6 3
Bakery Plants 6 2
Ice Cream Plants 2 2
Cheese & Meat Packing Plants – 2
Soft Drink Bottling Plants 4 –
Fruit & Vegetable Processing Plants 1 3
Cake Commissary 1 –
20 12
PE R CEN TAG E O F S TO R ES W I T H
S P EC I A LT Y D E PA R T M E N T S AN D
FU E L S T AT I O N S
Year-end 2009
Specialty Departments
Deli 97%
Floral 96%
Bakery 95%
Pharmacy 77%
Starbucks 67%
Fuel Stations 22%