Safeway 2009 Annual Report Download - page 7
Download and view the complete annual report
Please find page 7 of the 2009 Safeway annual report below. You can navigate through the pages in the report by either clicking on the pages listed below, or by using the keyword search tool below to find specific information within the annual report.-
 1
1 -
 2
2 -
 3
3 -
 4
4 -
 5
5 -
 6
6 -
 7
7 -
 8
8 -
 9
9 -
 10
10 -
 11
11 -
 12
12 -
 13
13 -
 14
14 -
 15
15 -
 16
16 -
 17
17 -
 18
18 -
19
-
20
-
21
-
22
-
23
-
24
-
25
-
26
-
27
-
28
-
29
-
30
-
31
-
32
-
33
-
34
-
35
-
36
-
37
-
38
-
39
-
40
-
41
-
42
-
43
-
44
-
45
-
46
-
47
-
48
-
49
-
50
-
51
-
52
-
53
-
54
-
55
-
56
-
57
-
58
-
59
-
60
-
61
-
62
-
63
-
64
-
65
-
66
-
67
-
68
-
69
-
70
-
71
-
72
-
73
-
74
-
75
-
76
-
77
-
78
-
79
-
80
-
81
-
82
-
83
-
84
-
85
-
86
-
87
-
88
-
89
-
90
-
91
-
92
-
93
-
94
-
95
-
96
-
97
-
98
-
99
-
100
-
101
-
102
 |
 |

P A G E F I V E
S A F E W A Y I N C . • • 2 0 0 9 A N N U A L R E P O R T
one less week in 2009. Unprecedented levels of
deflation in key categories such as dairy, produce
and meat, as well as our investments in price,
reduced sales dollars. In addition, consumers
continued to closely monitor their spending,
trading down to private label goods and other
lower-priced items.
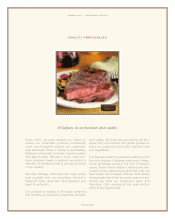
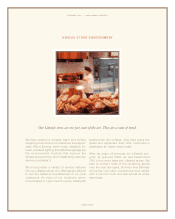
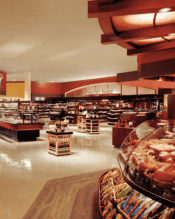
Since 2003, we have focused on differentiating
our stores with high-quality perishables, creating
a unique store environment, expanding our
proprietary offerings and providing more everyday
values. At the same time, we are managing costs
while enhancing the customer experience and
continuing our track record of innovation in the
supermarket business. We believe we are very
well prepared to meet and exceed our customers’
needs, and in turn to grow our market share, as
the economy improves.
During the year, we opened eight new stores and
remodeled 82 stores, bringing the number of
Lifestyle stores to 79% of our base at year-end
2009. Our capital spending totaled $852 million
for the year.
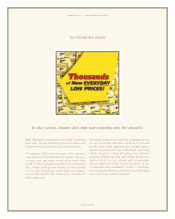
In 2009, we significantly accelerated our price
investments to provide the value that today’s
customer is looking for—every day. This included
fine-tuning the pricing for our growing array of
Consumer Brand products and other frequently
purchased items. In numerous cases, these
actions have resulted in noticeably higher volumes.
We are encouraged by the positive momentum we
have generated.
At the same time, we continued to reduce
operating costs. In 2009, we set a target to
increase our cost reduction efforts by 50% from
2008 levels, and through a broad range of
initiatives, including increasing efficiencies across
our supply chain, retail and backstage operations,
we significantly exceeded our goal. These results
helped us offset some of our price investments.
We continue to develop a variety of innovative
products and pursue vehicles for continued
growth. We grew our Consumer Brands portfolio
and expanded our Blackhawk Network gift card
business. In addition, we are pursuing avenues to
leverage our expertise and success in managing
healthcare costs.
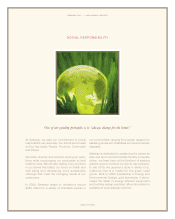
We are also deeply concerned about the
communities in which we operate, and we continue
to give back through fundraising and charitable
contributions, which exceeded $250 million in
2009, and sustainable business practices. Our
efforts were recognized when we were added to
the Dow Jones Sustainability Index North America
in 2009. Our work continues in 2010; in a short
period in January, we raised and donated over
$2.5 million to help the Haiti earthquake victims.
I want to extend my sincere appreciation to our
dedicated employees for all their hard work, to our
customers for their loyalty and to our stockholders
for their continued support as we enter into a new
decade. We are confident in our strategy moving
forward and remain committed to creating
increased stockholder value in 2010 and beyond.
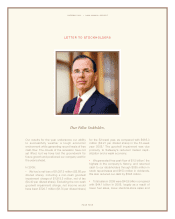
Sincerely,
Steven A. Burd
Chairman, President and Chief Executive Officer
March 2, 2010
1 Reconciliation tables follow the Annual Report on Form 10-K.