Safeway 2009 Annual Report Download - page 45
Download and view the complete annual report
Please find page 45 of the 2009 Safeway annual report below. You can navigate through the pages in the report by either clicking on the pages listed below, or by using the keyword search tool below to find specific information within the annual report.-
 1
1 -
2
-
3
-
4
-
5
-
6
-
7
-
8
-
9
-
10
-
11
-
12
-
13
-
14
-
15
-
16
-
17
-
18
-
19
-
20
-
21
-
22
-
23
-
24
-
25
-
26
-
27
-
28
-
29
-
30
-
31
-
32
-
33
-
34
-
 35
35 -
 36
36 -
 37
37 -
 38
38 -
 39
39 -
 40
40 -
 41
41 -
 42
42 -
 43
43 -
 44
44 -
 45
45 -
 46
46 -
 47
47 -
 48
48 -
 49
49 -
 50
50 -
 51
51 -
 52
52 -
 53
53 -
 54
54 -
 55
55 -
56
-
57
-
58
-
59
-
60
-
61
-
62
-
63
-
64
-
65
-
66
-
67
-
68
-
69
-
70
-
71
-
72
-
73
-
74
-
75
-
76
-
77
-
78
-
79
-
80
-
81
-
82
-
83
-
84
-
85
-
86
-
87
-
88
-
89
-
90
-
91
-
92
-
93
-
94
-
95
-
96
-
97
-
98
-
99
-
100
-
101
-
102
 |
 |
SAFEWAY INC. AND SUBSIDIARIES
Liquidity and Financial Resources
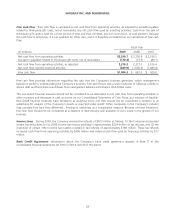
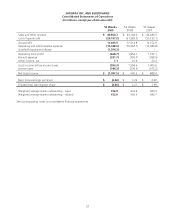
Net cash flow from operating activities was $2,549.7 million in 2009, $2,250.9 million in 2008 and $2,190.5 million in
2007. Certain tax items increased cash flow from operating activities in 2009 by approximately $396 million.
Blackhawk receives a significant portion of the cash inflow from the sale of third-party gift cards late in the fourth quarter
of the year and remits the majority of the cash, less commissions, to the card partners early in the first quarter of the
following year. Blackhawk’s net payables related to third-party gift cards increased to $170.4 million in 2009 from $23.9
million in 2008 primarily as a result of the growth of the business and the change in the timing of holiday sales compared
to fiscal year end.
Historically, cash contributions to the Company’s retirement plans have been relatively small. For example, cash
contributions were $16.7 million and $33.8 million in 2009 and 2008, respectively, and were limited primarily to our
Canadian retirement plans. The decline in the financial markets during 2008 resulted in a substantial reduction in the fair
value of the retirement plan assets. As a result, at the end of fiscal 2008 and fiscal 2009, pension benefit obligations
exceeded the fair value of plans assets for all of the Company’s pension plans. The Company currently expects to
contribute approximately $7.8 million to its defined benefit pension plan trusts in 2010, primarily in Canada. If return on
plan assets is less than expected or if discount rates decline, plan contributions could increase significantly in 2011 and
beyond.
Net cash flow used by investing activities, which consists principally of cash paid for property additions, was $889.0
million in 2009, $1,546.0 million in 2008 and $1,686.4 million in 2007. Net cash flow used by investing activities declined
in 2009 and 2008 because of reduced capital expenditures, partly offset by lower proceeds from the sale of property.
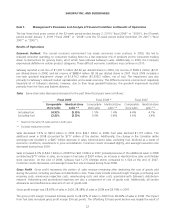
Cash paid for property additions declined to $0.9 billion in 2009 from $1.6 billion in 2008 and $1.8 billion in 2007. The
decline in capital expenditures was made possible by fewer competitive store openings, the near-completion of Safeway’s
Lifestyle rollout, and the condition of Safeway’s assets. In 2009, the Company opened eight new Lifestyle stores and
completed 82 Lifestyle store remodels. The Company also completed ten other remodels. During 2008, Safeway invested
$1.6 billion in capital expenditures. In 2008, the Company opened 20 new Lifestyle stores and completed 232 Lifestyle
store remodels. The Company also completed 21 other remodels. During 2007, Safeway invested $1.8 billion in capital
expenditures. In 2007, the Company opened 20 new Lifestyle stores, completed 253 Lifestyle remodels. In 2010, the
Company expects to spend $0.9 billion to $1.0 billion in cash capital expenditures and to open approximately 20 new
Lifestyle stores and to remodel approximately 80 stores into Lifestyle stores. Safeway expects to convert most of the
remaining stores to Lifestyle stores over the next few years.
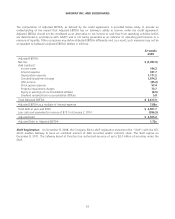
Net cash flow used by financing activities was $1,600.3 million in 2009, $594.3 million in 2008 and $454.0 million in
2007. In 2009, Safeway paid down $599.5 million of debt, repurchased $884.9 million of common stock and paid
$153.1 million of dividends. In 2008, the Company paid down $130.0 million of debt, repurchased $359.5 million of
common stock and paid $132.1 million of dividends. In 2007, Safeway paid down $261.3 million of debt, repurchased
$226.1 million of common stock and paid $111.5 million of dividends.
Based upon the current level of operations, Safeway believes that net cash flow from operating activities and other
sources of liquidity, including potential borrowing under Safeway’s commercial paper program and its credit agreement,
will be adequate to meet anticipated requirements for working capital, capital expenditures, interest payments, dividend
payments, stock repurchases, if any, and scheduled principal payments for the foreseeable future. There can be no
assurance, however, that Safeway’s business will continue to generate cash flow at or above current levels or that the
Company will maintain its ability to borrow under its commercial paper program and credit agreement.
27