Safeway 2009 Annual Report Download - page 70
Download and view the complete annual report
Please find page 70 of the 2009 Safeway annual report below. You can navigate through the pages in the report by either clicking on the pages listed below, or by using the keyword search tool below to find specific information within the annual report.-
 1
1 -
2
-
3
-
4
-
5
-
6
-
7
-
8
-
9
-
10
-
11
-
12
-
13
-
14
-
15
-
16
-
17
-
18
-
19
-
20
-
21
-
22
-
23
-
24
-
25
-
26
-
27
-
28
-
29
-
30
-
31
-
32
-
33
-
34
-
35
-
36
-
37
-
38
-
39
-
40
-
41
-
42
-
43
-
44
-
45
-
46
-
47
-
48
-
49
-
50
-
51
-
52
-
53
-
54
-
55
-
56
-
57
-
58
-
59
-
 60
60 -
 61
61 -
 62
62 -
 63
63 -
 64
64 -
 65
65 -
 66
66 -
 67
67 -
 68
68 -
 69
69 -
 70
70 -
 71
71 -
 72
72 -
 73
73 -
 74
74 -
 75
75 -
 76
76 -
 77
77 -
 78
78 -
 79
79 -
 80
80 -
81
-
82
-
83
-
84
-
85
-
86
-
87
-
88
-
89
-
90
-
91
-
92
-
93
-
94
-
95
-
96
-
97
-
98
-
99
-
100
-
101
-
102
 |
 |

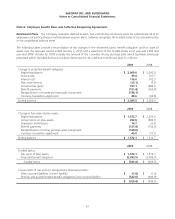
SAFEWAY INC. AND SUBSIDIARIES
Notes to Consolidated Financial Statements
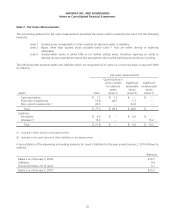
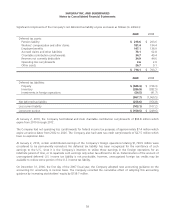
Note F: Fair Value Measurements
The accounting guidance for fair value measurements prioritizes the inputs used in measuring fair value into the following
hierarchy:
Level 1 Quoted prices (unadjusted) in active markets for identical assets or liabilities;
Level 2 Inputs other than quoted prices included within Level 1 that are either directly or indirectly
observable;
Level 3 Unobservable inputs in which little or no market activity exists, therefore requiring an entity to
develop its own assumptions about the assumptions that market participants would use in pricing.
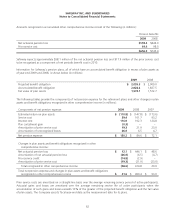
The following table presents assets and liabilities which are measured at fair value on a recurring basis at year-end 2009
(in millions):
Fair value measurements
Assets: Total
Quoted prices in
active markets
for identical
assets
(Level 1)
Significant
observable
inputs
(Level 2)
Significant
unobservable
inputs
(Level 3)
Cash equivalents $ 1.2 $ 1.2 $ – $ –
Short-term investments 51.8 48.1 3.7 –
Non-current investments (1) 24.3 – 24.3 –
Total $ 77.3 $ 49.3 $ 28.0 $ –
Liabilities:
Derivatives $ 6.6 $ – $ 6.6 $ –
Warrants (2) 15.2 – – 15.2
Total $ 21.8 $ – $ 6.6 $ 15.2
(1) Included in Other Assets on the balance sheet.
(2) Included in Accrued Claims and Other Liabilities on the balance sheet.
A reconciliation of the beginning and ending balances for Level 3 liabilities for the year ended January 2, 2010 follows (in
millions):
Warrants
Balance as of January 3, 2009 $10.7
Additions 0.4
Unrealized losses, net of gains 4.1
Balance as of January 2, 2010 $15.2
52