Verizon Wireless 2014 Annual Report Download - page 11
Download and view the complete annual report
Please find page 11 of the 2014 Verizon Wireless annual report below. You can navigate through the pages in the report by either clicking on the pages listed below, or by using the keyword search tool below to find specific information within the annual report.-
 1
1 -
 2
2 -
 3
3 -
 4
4 -
 5
5 -
 6
6 -
 7
7 -
 8
8 -
 9
9 -
 10
10 -
 11
11 -
 12
12 -
 13
13 -
 14
14 -
 15
15 -
 16
16 -
 17
17 -
 18
18 -
 19
19 -
 20
20 -
 21
21 -
 22
22 -
23
-
24
-
25
-
26
-
27
-
28
-
29
-
30
-
31
-
32
-
33
-
34
-
35
-
36
-
37
-
38
-
39
-
40
-
41
-
42
-
43
-
44
-
45
-
46
-
47
-
48
-
49
-
50
-
51
-
52
-
53
-
54
-
55
-
56
-
57
-
58
-
59
-
60
-
61
-
62
-
63
-
64
-
65
-
66
-
67
-
68
-
69
-
70
-
71
-
72
-
73
-
74
-
75
-
76
-
77
-
78
-
79
-
80
 |
 |

9
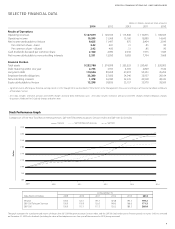
SELECTED FINANCIAL DATA
VERIZON COMMUNICATIONS INC. AND SUBSIDIARIES
Verizon S&P 500 Telecom Services S&P 500
Stock Performance Graph
$120
$100
$80
$60
$160
$180
$200
$140
$220
Dollars
Comparison of Five-Year Total Return Among Verizon, S&P 500 Telecommunications Services Index and S&P 500 Stock Index
2014
2009 2010 2011 2012 2013
The graph compares the cumulative total returns of Verizon, the S&P 500 Telecommunications Services Index, and the S&P 500 Stock Index over a five-year period. It assumes $100 was invested
on December 31, 2009 with dividends (including the value of the telephone access line spin-off that occurred in 2010) being reinvested.
Data Points in Dollars
At December 31,
2009 2010 2011 2012 2013 2014
Verizon 100.0 123.1 145.7 164.8 195.3 194.2
S&P 500 Telecom Services 100.0 119.0 126.5 149.6 166.6 171.5
S&P 500 100.0 115.1 117.5 136.2 180.3 205.0
(dollars in millions, except per share amounts)
2014 2013 2012 2011 2010
Results of Operations
Operating revenues $ 127,079 $ 120,550 $ 115,846 $ 110,875 $ 106,565
Operating income 19,599 31,968 13,160 12,880 14,645
Net income attributable to Verizon 9,625 11,497 875 2,404 2,549
Per common share – basic 2.42 4.01 .31 .85 .90
Per common share – diluted 2.42 4.00 .31 .85 .90
Cash dividends declared per common share 2.160 2.090 2.030 1.975 1.925
Net income attributable to noncontrolling interests 2,331 12,050 9,682 7,794 7,668
Financial Position
Total assets $ 232,708 $ 274,098 $ 225,222 $ 230,461 $ 220,005
Debt maturing within one year 2,735 3,933 4,369 4,849 7,542
Long-term debt 110,536 89,658 47,618 50,303 45,252
Employee benet obligations 33,280 27,682 34,346 32,957 28,164
Noncontrolling interests 1,378 56,580 52,376 49,938 48,343
Equity attributable to Verizon 12,298 38,836 33,157 35,970 38,569
• Significanteventsaffectingourhistoricalearningstrendsin2012through2014aredescribedin“OtherItems”inthe“Management’sDiscussionandAnalysisofFinancialConditionandResults
ofOperations”section.
• 2011 data includes severance, pension and benefit charges and early debt redemption costs. 2010 data includes severance, pension and benefit charges, merger integration charges,
dispositions,MedicarePartDSubsidychargesandotheritems.