Verizon Wireless 2014 Annual Report Download - page 21
Download and view the complete annual report
Please find page 21 of the 2014 Verizon Wireless annual report below. You can navigate through the pages in the report by either clicking on the pages listed below, or by using the keyword search tool below to find specific information within the annual report.-
 1
1 -
2
-
3
-
4
-
5
-
6
-
7
-
8
-
9
-
10
-
 11
11 -
 12
12 -
 13
13 -
 14
14 -
 15
15 -
 16
16 -
 17
17 -
 18
18 -
 19
19 -
 20
20 -
 21
21 -
 22
22 -
 23
23 -
 24
24 -
 25
25 -
 26
26 -
 27
27 -
 28
28 -
 29
29 -
 30
30 -
 31
31 -
32
-
33
-
34
-
35
-
36
-
37
-
38
-
39
-
40
-
41
-
42
-
43
-
44
-
45
-
46
-
47
-
48
-
49
-
50
-
51
-
52
-
53
-
54
-
55
-
56
-
57
-
58
-
59
-
60
-
61
-
62
-
63
-
64
-
65
-
66
-
67
-
68
-
69
-
70
-
71
-
72
-
73
-
74
-
75
-
76
-
77
-
78
-
79
-
80
 |
 |
19
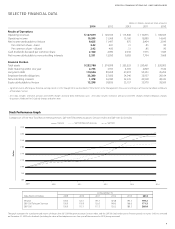
MANAGEMENT’S DISCUSSION AND ANALYSIS
OF FINANCIAL CONDITION AND RESULTS OF OPERATIONS continued
Service Revenue
Service revenue, which does not include recurring equipment install-
ment billings related to Verizon Edge, increased by $3.6 billion, or 5.2%,
during 2014 compared to 2013 primarily driven by higher retail postpaid
service revenue, which increased largely as a result of an increase in retail
postpaid connections as well as the continued increase in penetration
of4GLTEsmartphonesandtabletsthroughourMoreEverythingplans.
The penetration of 4G LTE smartphones was driven by the activation of
smartphones by new customers as well as existing customers migrating
from basic phones and 3G smartphones to 4G LTE smartphones.
TheincreaseinretailpostpaidARPA(theaveragerevenueperaccount
from retail postpaid accounts), which does not include recurring equip-
ment installment billings related to Verizon Edge, during 2014 compared
to 2013 was primarily driven by increases in smartphone penetration and
retail postpaid connections per account. As of December 31, 2014, we
experienced a 4.0% increase in retail postpaid connections per account
compared to 2013, with smartphones representing 79% of our retail
postpaid phone base as of December 31, 2014 compared to 70% as of
December 31, 2013. The increased penetration in retail postpaid connec-
tions per account is primarily due to increases in Internet data devices,
which represented 14.1% of our retail postpaid connection base as of
December 31, 2014 compared to 10.7% as of December 31, 2013, pri-
marily due to tablet activations. Additionally, during 2014, postpaid
smartphone activations represented 92% of phones activated compared
to 86% during 2013.
Other service revenue increased during 2014 compared to 2013 due to
growth in wholesale connections.
Equipment and Other Revenue
Equipment and other revenue increased during 2014 compared to 2013
primarily due to an increase in equipment sales under both the tradi-
tional subsidy model and Verizon Edge.
2013 Compared to 2012
TheincreaseinWireless’totaloperatingrevenuesof$5.2billion,or6.8%,
during 2013 compared to 2012 was primarily the result of growth in
service revenue.
Accounts and Connections
Retail postpaid connection net additions decreased during 2013
compared to 2012 primarily due to an increase in our retail postpaid
connection churn rate, partially oset by an increase in retail postpaid
connection gross additions.
Retail Postpaid Connections per Account
Retailpostpaidconnectionsperaccountincreased4.5%asofDecember
31, 2013 compared to December 31, 2012 primarily due to the increased
penetration of tablets and other Internet devices.
Service Revenue
Service revenue increased $5.3 billion, or 8.3%, during 2013 compared
to 2012 primarily driven by higher retail postpaid service revenue, which
increased largely as a result of an increase in retail postpaid connections
as well as the continued increase in penetration of smartphones, tab-
lets and other Internet devices through our Share Everything plans. The
penetration of smartphones was driven by the activation of smartphones
by new customers as well as existing customers migrating from basic
phones to smartphones.
TheincreaseinretailpostpaidARPAduring2013comparedto2012was
primarily driven by increases in smartphone penetration and retail post-
paid connections per account. As of December 31, 2013, we experienced
a 4.5% increase in retail postpaid connections per account compared to
2012, with smartphones representing 70% of our retail postpaid phone
base as of December 31, 2013 compared to 58% as of December 31, 2012.
The increased penetration in retail postpaid connections per account is
primarily due to increases in Internet data devices, which represented
10.7% of our retail postpaid connection base as of December 31, 2013
compared to 9.3% as of December 31, 2012, primarily due to activations
of tablets and other Internet devices. Additionally, during 2013, postpaid
smartphone activations represented 86% of phones activated compared
to 77% during 2012.
Other service revenue increased during 2013 compared to 2012 due to
growth in wholesale connections, partially oset by a decrease in rev-
enue related to third party roaming.
Equipment and Other Revenue
Equipment and other revenue decreased during 2013 compared to 2012
as a decline in regulatory fees was partially oset by an increase in rev-
enue related to upgrade fees.